Penerangan
LogicLadder Pivots – Pengimbas Struktur Pasaran & Corak Lanjutan
Buka struktur tersembunyi pasaran dengan LogicLadder Pivots.
Penunjuk LogicLadder Pivots adalah alat tindakan harga tahap profesional yang direka untuk membantu pedagang memvisualisasikan struktur pasaran, mengenal pasti tren, dan mengesan corak pembalikan berkemungkinan tinggi secara automatik. Dengan menggabungkan logik ZigZag klasik dengan pemantauan pelbagai jangka masa yang maju, alat ini bertindak sebagai penganalisis pasaran peribadi anda, memastikan carta anda bersih sambil memberi amaran kepada anda tentang pergerakan harga kritikal.
🚀 Ciri Utama
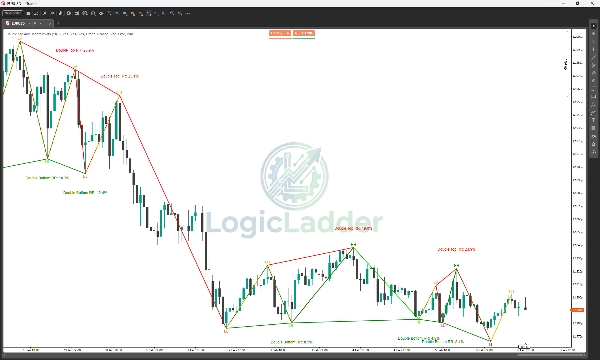
- Struktur Pasaran Automatik: Secara automatik melabel Higher Highs (HH), Lower Highs (LH), Higher Lows (HL), dan Lower Lows (LL), memberikan anda bacaan segera mengenai arah tren semasa.
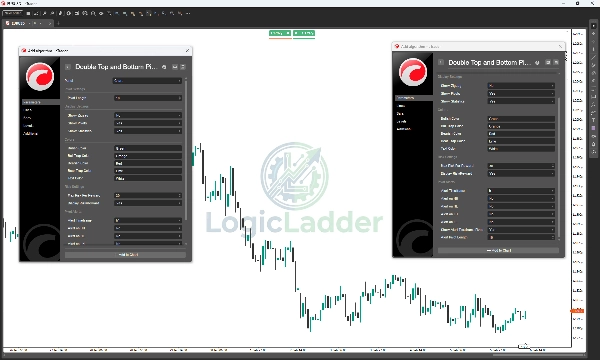
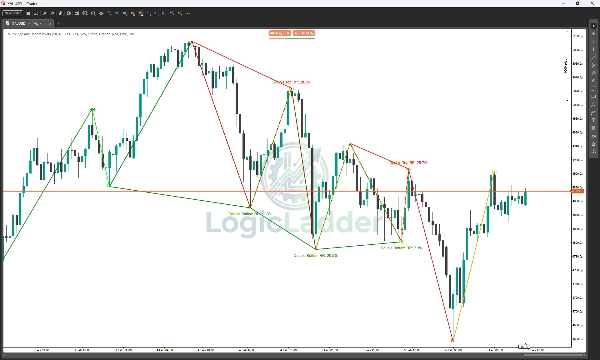
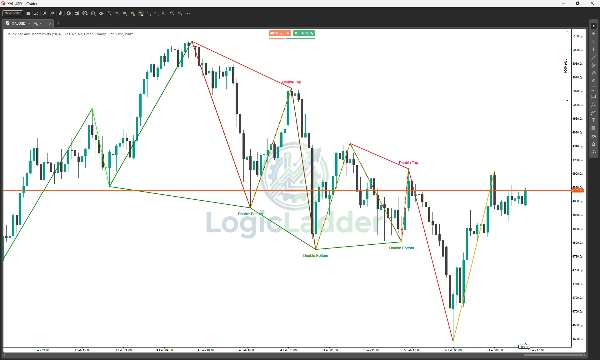
- Pengesanan Corak Pintar: Mengimbas untuk Double Top dan Double Bottom dalam masa nyata. Ia bukan sahaja mencari corak; ia menapisnya berdasarkan nisbah Risk-to-Reward (RR) yang dikira untuk memastikan anda hanya melihat susunan yang paling boleh diambil tindakan.
- Amaran Pelbagai Jangka Masa (MTF): Pantau jangka masa yang lebih tinggi (contoh, H4 atau Harian) semasa berdagang pada jangka masa yang lebih rendah. Penunjuk akan memberi amaran apabila pivot utama terbentuk pada jangka masa pengawasan anda, memastikan anda tidak pernah berdagang bertentangan dengan tren utama.
- Panel Statistik Interaktif: Papan pemuka bersih di carta memaparkan status semasa pengesanan corak (Mengimbas, Double Top Dikesan, dll.).
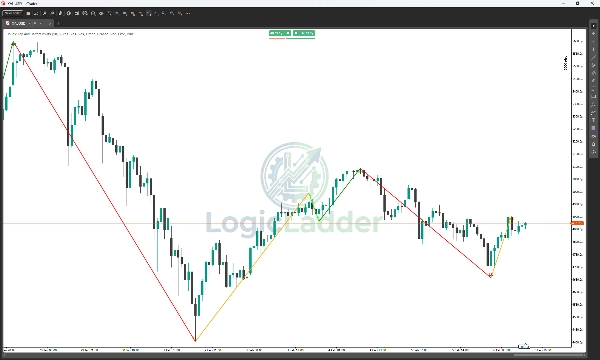
- Visualisasi ZigZag: Melukis garis tren yang jelas dan boleh disesuaikan yang memotong bunyi bising, membantu anda memberi tumpuan pada ayunan harga yang penting.
- Sepenuhnya Boleh Disesuaikan: Sesuaikan setiap aspek penunjuk mengikut gaya perdagangan anda. Laraskan kepekaan pivot (Panjang), tukar warna untuk struktur Bullish/Bearish, dan togol elemen visual yang berbeza hidup atau mati.
🎨 Panduan Visual & Strategi Warna
Sistem LogicLadder menggunakan kod warna 4 khusus untuk memberitahu anda cerita struktur pasaran dengan segera. Berikut adalah cara membaca "Tangga":
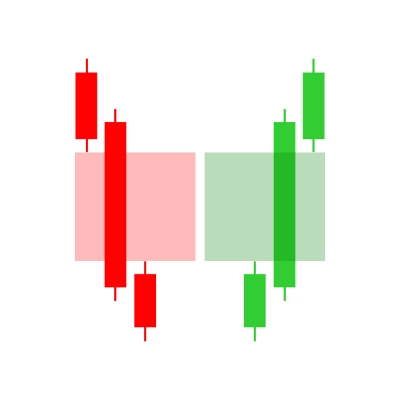
1. 🟢 Hijau (Bullish - Kuat)
- Apa itu: Digunakan untuk Higher Highs (HH).
- Apa maksudnya: Pembeli mengawal sepenuhnya. Pasaran membuat paras tertinggi baru.
- Tindakan: Cari peluang membeli atau pegang posisi panjang sedia ada.
2. 🔴 Merah (Bearish - Kuat)
- Apa itu: Digunakan untuk Lower Lows (LL).
- Apa maksudnya: Penjual mengawal sepenuhnya. Pasaran jatuh ke paras terendah baru.
- Tindakan: Cari peluang menjual atau pegang posisi pendek sedia ada.
3. 🟠 Oren (Perangkap Bull - Kelemahan)
- Apa itu: Digunakan untuk Lower Highs (LH).
- Apa maksudnya: Pembeli cuba menolak harga naik tetapi gagal memecahkan paras tinggi sebelumnya. Ini adalah "Perangkap Bull"—pembeli lewat kini terperangkap apabila momentum berkurangan.
- Tindakan: Tanda amaran! Jika anda Long, pertimbangkan untuk mengambil keuntungan. Perhatikan kemungkinan pembalikan tren ke bawah.
4. 🟢 Limau Nipis (Perangkap Bear - Kekuatan)
- Apa itu: Digunakan untuk Higher Lows (HL).
- Apa maksudnya: Penjual cuba menolak harga turun tetapi gagal memecahkan paras rendah sebelumnya. Ini adalah "Perangkap Bear"—penjual lewat terperangkap apabila sokongan bertahan.
- Tindakan: Tanda peluang! Ini sering menandakan permulaan tren menaik baru. Perhatikan isyarat masuk untuk pergi Long.
📉 Cara Berdagang "Tangga"
- Mod Tren Naik: Anda mahu melihat corak Hijau (HH) yang disambungkan kepada Limau Nipis (HL). Ini mengesahkan tangga menaik yang sihat.
- Mod Tren Turun: Anda mahu melihat corak Merah (LL) yang disambungkan kepada Oren (LH). Ini mengesahkan tangga menurun yang curam.
- Pengesanan Pembalikan:
-
- Potensi Atas: Jika anda melihat Hijau (HH) diikuti serta-merta oleh Oren (LH), tren naik kehilangan tenaga.
- Potensi Bawah: Jika anda melihat Merah (LL) diikuti serta-merta oleh Limau Nipis (HL), tekanan jualan telah habis.
💡 Cara Ia Berfungsi
- Analisis Pivot: Penunjuk menganalisis tempoh lookback yang ditetapkan pengguna (lalai: 10 bar) untuk mengenal pasti ayunan tinggi dan rendah yang signifikan.
- Logik Tren: Ia menghubungkan titik-titik ini untuk memvisualisasikan "Tangga" harga—menunjukkan dengan tepat bila tren memecahkan struktur atau menghormati sokongan/rintangan.
- Pengesahan Pembalikan: Apabila tindakan harga membentuk struktur "W" (Double Bottom) atau "M" (Double Top) yang memenuhi kriteria Risiko/Imbangan anda, penunjuk melukis corak pada carta dan mengemas kini panel status.
🔔 Amaran & Pemberitahuan
Sentiasa maklum tanpa perlu menatap skrin. LogicLadder Pivots termasuk sistem amaran yang kukuh:
- Amaran Log: Mesej terperinci dicetak ke log cTrader apabila corak atau pivot berlaku.
- Pemantauan MTF: Dapatkan pemberitahuan apabila Pivot High atau Low struktur terbentuk pada jangka masa amaran pilihan anda (contoh, terima amaran untuk Pivot Low 4-Jam semasa scalping carta 5-Minit).
⚙️ Parameter
- Panjang Pivot: Kepekaan pengesanan ayunan.
- Offset Label: Laraskan jarak label teks dari sumbu lilin untuk keterlihatan lebih baik.
- Risiko Maksimum Per Imbangan: Tapis corak berdasarkan kecekapan (lalai: 30%).
- Jangka Masa Amaran: Pilih jangka masa sekunder untuk dipantau.
- Tetapan Visual: Kawalan penuh ke atas warna untuk pergerakan Bullish, Bearish, dan Perangkap.
Ringkasan
The indicator detects Double Top and Double Bottom reversal patterns in real-time, filtering them by a calculated Risk-to-Reward ratio to highlight the most actionable setups. It supports alerts for pivot formations on higher timeframes while trading on lower ones, helping users align trades with major trends.
A customizable on-chart stats panel displays the current pattern detection status, and clear ZigZag trend lines visualize significant price swings. Users can adjust pivot sensitivity, label positioning, and color schemes for bullish, bearish, and trap moves to fit their trading style.
The tool employs a four-color system to represent market conditions: green for strong bullish moves (HH), red for strong bearish moves (LL), orange for bull traps (LH), and lime for bear traps (HL). This visual guide aids in spotting trend continuations and potential reversals. Alerts include detailed log messages and MTF notifications to keep traders informed.