Descrizione
TrendFallowing: è un indicatore tecnico avanzato per la piattaforma cTrader che combina molteplici approcci analitici in un'unica soluzione. Sviluppato per i trader che cercano la conferma del trend attraverso la convergenza degli indicatori, offre una visione completa del mercato con segnali precisi e filtri di validazione.
GUARDA IL VIDEO INTRODUTTIVO SULLA STRATEGIA OPERATIVA!
🎯 STRATEGIE DI UTILIZZO
1. Trading Trend Following
Applicazione: Identificare e seguire trend consolidati
Timeframe: H4, D1 per posizioni più lunghe
Impostazioni: ADX > 25, Volume sopra la media
Gestione del rischio: Stop-loss sotto la media mobile a 50 periodi
2. Swing Trading
Applicazione: Catturare movimenti di medio termine
Timeframe: H1, H4
Impostazioni: Filtro volume attivato, conferma tramite Volume Profile
Obiettivi: Volume Profile POC come TP
3. Breakout Trading
Applicazione: Entrare su rotture di supporti/resistenze
Impostazioni: Volume PVA per confermare la forza del movimento
Conferma: ADX in crescita + Volume sopra la media
4. Scalping (Timeframe più brevi)
Applicazione: Operazioni rapide con molteplici conferme
Timeframe: M1, M5
Impostazioni: Filtri volume rigorosi e Momentum
🔧 COME FUNZIONANO GLI INDICATORI
CORE ADX & DI
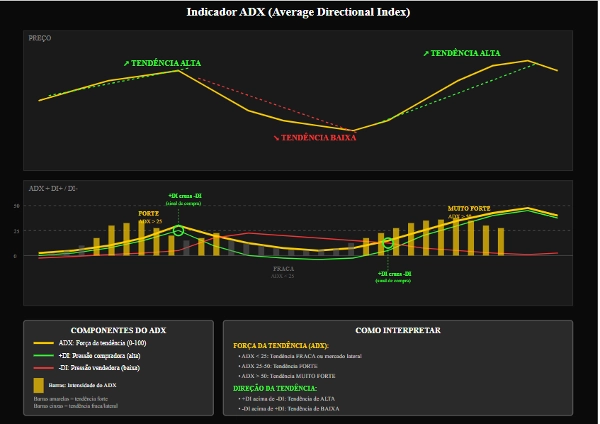
ADX (Average Directional Index)
Funzione: Misurare la forza del trend
Interpretazione:
0-25: Trend debole/movimento laterale
25-50: Trend forte
50+: Trend molto forte
Uso pratico: Evitare operazioni quando ADX < 20
+DI / -DI (Indicatori Direzionali)
+DI: Forza degli acquirenti
-DI: Forza dei venditori
Segnale: Incrocio di +DI sopra -DI (acquisto) e viceversa
Pendenza ADX (ADX Slope)
Funzione: Misurare l'accelerazione del trend
Grafico: Istogramma ciano
Segnale: Valori positivi indicano un trend in rafforzamento
FILTRI VOLUME
Filtro Volume MA
Funzione: Validare i segnali con volume superiore alla media
Parametri: Periodo 20, Moltiplicatore 1.0
Uso: Conferma dell'interesse istituzionale
Volume PVA (Price Volume Analysis)
Colori e significato:
Verde: Acquisto con volume molto alto (>150% della media)
Blu: Acquisto con volume alto
Rosso: Vendita con volume molto alto
Rosa: Vendita con volume alto
Giallo: Pin Bar/Esaurimento con rottura del supporto
VOLUME PROFILE
POC (Point of Control)
Funzione: Prezzo con il volume più scambiato
Uso: Obiettivo naturale per le operazioni, supporto/resistenza dinamico
Area di Valore
Funzione: Zona dove è stato scambiato il 70% del volume
Interpretazione:
Prezzo sopra: Trend rialzista
Prezzo sotto: Trend ribassista
All'interno: Possibile movimento laterale
Pannello Indicatore
RSI: Ipervenduto (<30) / Ipercomprato (>70)
MACD: Momentum
Williams %R: Condizioni estreme
CCI: Identificazione di inversione
Stocastico: Momentum a breve termine
Ultimate Oscillator: Momentum multi-timeframe
Medie Mobili
Set completo di MA (5, 10, 20, 50, 100, 200)
Analisi di allineamento per i trend
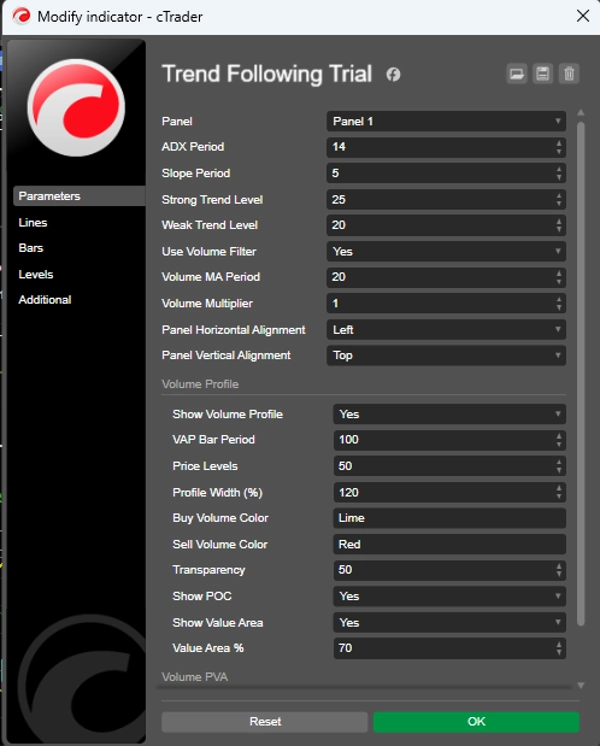
⚙️ IMPOSTAZIONI CONSIGLIATE
Impostazione conservativa
Periodo ADX: 14
Periodo pendenza: 5
Livello trend forte: 25
Livello trend debole: 20
Usa filtro volume: true
Periodo Volume MA: 20
Moltiplicatore volume: 1.2
Impostazione aggressiva
Periodo ADX: 10
Periodo pendenza: 3
Livello trend forte: 20
Livello trend debole: 15
Usa filtro volume: true
Periodo Volume MA: 14
Moltiplicatore volume: 1.0
Volume Profile (Consigliato)
Mostra Volume Profile: true
Periodo VAP Bar: 100
Livelli di prezzo: 50
% Area di Valore: 70
Mostra POC: true
🎨 RISORSE VISIVE
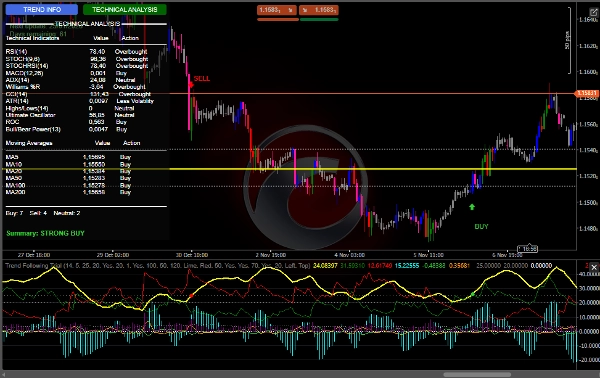
Interfaccia Utente
Pannello dinamico: Informazioni in tempo reale
Pulsanti interattivi: Passa tra le analisi
Colori intuitivi: Codifica basata sulla funzione
Segnali grafici
Frecce: Entrate BUY/SELL
Suoni: Avvisi udibili
Colori delle barre: Analisi PVA integrata