
Descrizione
Indicator del Pinescriptlabs Store: cBot del Pinescriptlabs Store : (cBot) Gold & BTC BreakoutSession Pivots(nuovo)
PRICE ACTION (Nuovo)
Trailing Smart Algorithm (nuovo)
Prediction Based on Linreg & ATR
SmartTrend Support &
Resistance
Lines
Analisi
Dinamica
della Struttura
di Mercato
dei
Punti di Inversione
Fibonacci
Linear
Regression
Multi-timeframe
Multi-Level
Candle Bias
Tracker
Auto
Supporto e
Resistenza
Trend
Lines
Tutti i
Livelli di
Supporto e
Resistenza
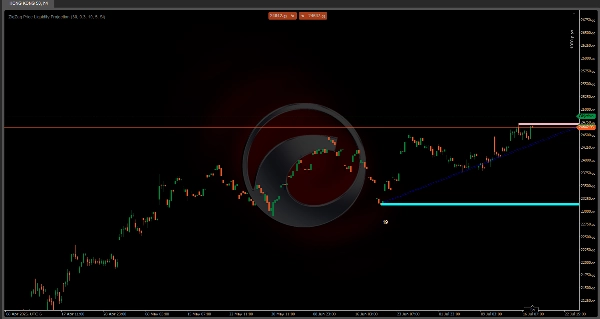
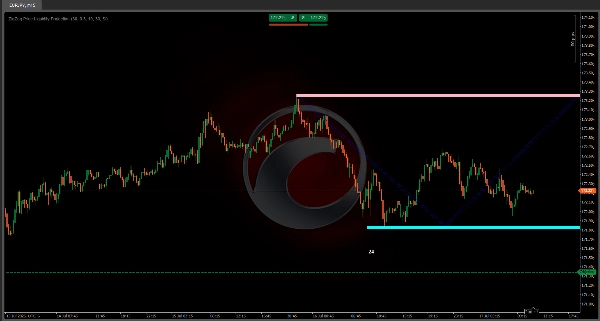
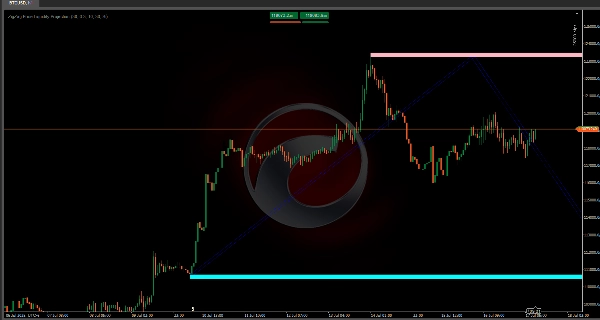
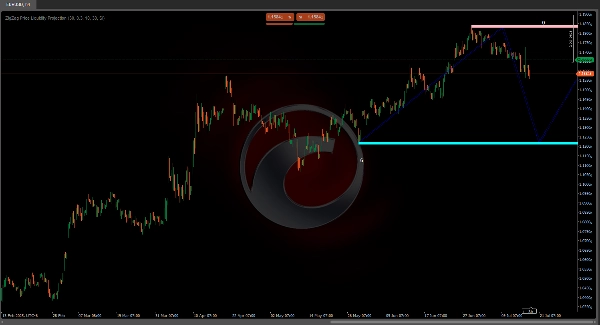
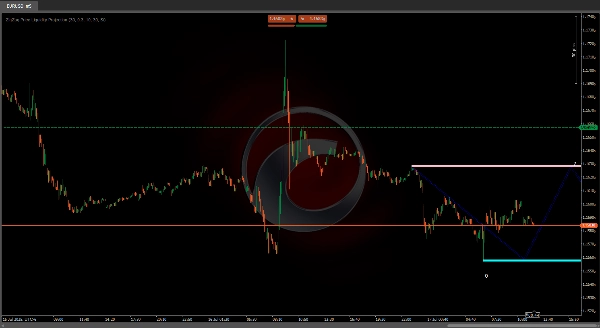
📊 Indicatore di Proiezione della Liquidità del Prezzo ZigZag
"Vedi dove il mercato potrebbe girare prima che accada!" 🔮
Questo indicatore identifica livelli chiave di supporto/resistenza 🛑 e predice zone di liquidità 💧 sul tuo grafico utilizzando:
- 🔍 Punti Pivot: Rileva massimi e minimi significativi
- 📈 Volatilità ATR: Misura le fluttuazioni di prezzo per una regolazione precisa
- 💦 Proiezioni di Liquidità: Anticipa aree di alta attività (cluster di acquisto/vendita) tramite pattern zigzag
🎯 Scopo: Predice zone di reazione del prezzo (rimbalzi/rotture/consolidamenti) per migliorare le decisioni di entrata/uscita
✨ Il Vantaggio dello Zigzag
Queste linee collegate agiscono come una mappa del tesoro 🗺️ mostrando:
1️⃣ Percorsi futuri del prezzo all'interno di intervalli definiti
2️⃣ Zone potenziali di inversione dove il prezzo potrebbe fermarsi o invertire
3️⃣ Punti di riferimento visivi per la pianificazione del trading
🚦 Caratteristiche Chiave:
- 📅 Sistema di allerta precoce per livelli importanti
- 🎯 Proietta mosse future basate su strutture pivot (percorsi rialzisti/ribassisti)
- 🔢 Contatori di tocchi (es. "24" = 24 test storici a quel livello)
⚙️ Impostazioni Consigliate
ImpostazioneValoreEffetto
Periodo ATR
30
🎚️ Sensibilità alla volatilità
Periodo Pivot
30
🔍 Intervallo di significatività del pivot
⏳ Timeframe Migliori: grafici 15min - 4hr ⏱️
💡 Consiglio Professionale:
"Combina con pattern a candela 🕯️ per conferma! Lo zigzag mostra DOVE il prezzo potrebbe andare, le candele mostrano QUANDO sta accadendo."
🎯 Conclusione Finale:
Uno strumento visivo tutto-in-uno potente per individuare:
✅ Zone di liquidità 💦
✅ Livelli critici 🎯
✅ Percorsi futuri del prezzo 🚀
Perfetto per i trader intraday che vogliono anticipare i movimenti invece di inseguirli! 🏃💨


![Logo di "[Stellar Strategies] Inside Bar with Signals"](https://cdn.ctrader.com/image/webp/1d9e8bfa-3b2c-4440-bb37-5856902008a7_30683)


