الوصف
📈 pATR – النطاق الحقيقي المتوسط المئوي
تقلب دقيق. مخاطرة أذكى. ميزة مؤسسية.
مؤشر pATR يعيد تعريف ATR التقليدي من خلال تطبيق فلتر قائم على النسبة المئوية لقيم النطاق الحقيقي الأخيرة، مما يمنح المتداولين رؤية إحصائية دقيقة للتقلبات. بدلاً من الاعتماد على المتوسطات البسيطة، يحسب pATR النسبة المئوية الـ nth لشدة حركة السعر الأخيرة — مما يساعدك على تحديد مناطق الاختراق، إعدادات التراجع، وحدود المخاطرة بدقة جراحية.
سواء كنت تتعامل مع تحديات شركات التداول أو تحسن استراتيجيتك في السكالبينج، يوفر pATR معيار تقلب ديناميكي يتكيف مع ظروف السوق ويحافظ على معايرة مخاطرك.
🔍 الميزات الرئيسية
• ATR قائم على النسبة المئوية: يُصفّي الضوضاء والأحداث الشاذة لإشارات تقلب أنظف
• منطق المخزن الدائري: محسّن للسرعة وكفاءة الذاكرة — بدون تأخير، بدون ازدحام
• جاهز لوضع التحدي: مثالي لمتداولي شركات التداول الذين يديرون السحب وحدود الصفقات
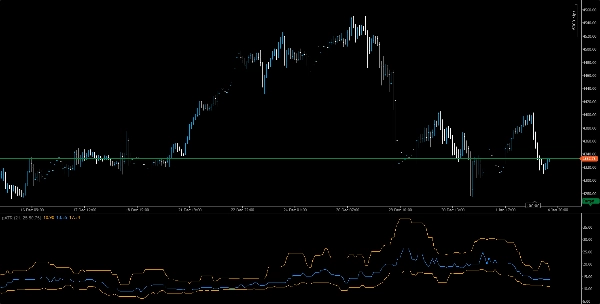
• مرئيات نظيفة: خط تقلب برتقالي مع خيارات مقياس وتراكب بديهية
• متوافق مع أطر زمنية متعددة: استخدمه عبر M1 إلى H1 لإعدادات الاختراق، التراجع، أو الاتجاه
🧠 حالات الاستخدام
• تأكيد الاختراق: استخدم ارتفاعات pATR للتحقق من دخول الزخم
• معايرة المخاطرة: مواءمة وقف الخسارة وحجم المركز مع تقلب النسبة المئوية
• اختبار الاستراتيجية: تحقق من الإعدادات باستخدام حدود تقلب متسقة
🎯 لمن هو
• متداولو شركات التداول الباحثون عن تحكم مخاطرة قائم على القواعد
• المتداولون السريعون واستراتيجيون التداول اليومي الذين يحتاجون إلى فلاتر تقلب متكيفة
• المتداولون الكميون الذين يدمجون منطق النسبة المئوية في أنظمة مخصصة
• المعلمون والمرشدون الذين يدرّسون تنفيذ التداول مع الوعي بالتقلبات
الملخص
Key features include an orange volatility line with intuitive scaling and overlay options, compatibility across multiple timeframes from 1-minute to 1-hour charts, and suitability for prop firm traders managing drawdowns and trade limits. pATR helps traders identify breakout zones, fade setups, and risk thresholds with precision.
Use cases cover breakout confirmation through volatility spikes, risk calibration by aligning stop-loss and position sizing with percentile volatility, and strategy backtesting using consistent volatility benchmarks. The indicator is designed for prop firm traders, scalpers, intraday strategists, quantitative traders integrating percentile logic, and educators focusing on volatility-aware execution.
Supported markets include Forex, stocks, indices, commodities, and cryptocurrencies, making pATR a versatile tool for various trading environments.