
Descrizione
Indicatore di Valore Ricorsivo Intrinseco
Panoramica
L'Indicatore di Valore Ricorsivo Intrinseco è un indicatore personalizzato che utilizza calcoli ricorsivi di forza relativa su più periodi per identificare le tendenze intrinseche del mercato. Determina livelli chiave di prezzo in cui la forza della tendenza raggiunge un livello critico, offrendo approfondimenti su potenziali inversioni e conferme di tendenza. Il concetto di Valore Ricorsivo Intrinseco si basa sull'idea che lo slancio del mercato e la forza della tendenza possano essere raffinati ricorsivamente applicando più livelli di analisi dell'azione del prezzo. Questo approccio ricorsivo aiuta a identificare condizioni rialziste e ribassiste profonde che gli indicatori tradizionali basati sul prezzo potrebbero trascurare.
Zone di Trading Rialziste e Ribassiste
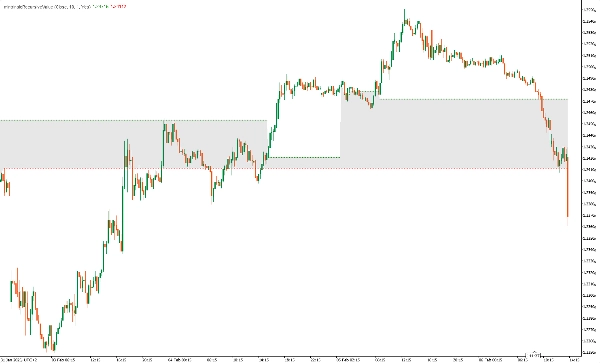
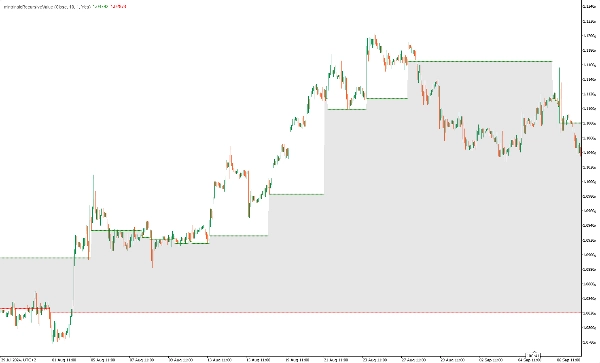
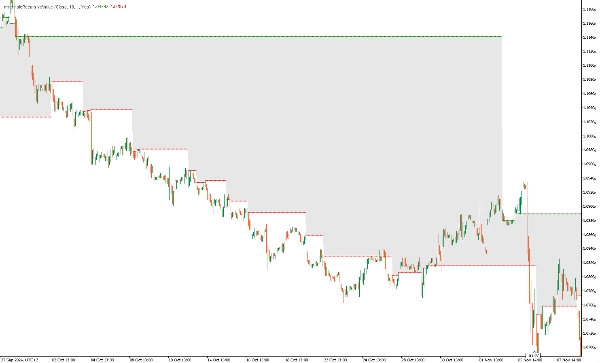
- Zona di Trading Rialzista: Questa zona si forma quando il valore ricorsivo intrinseco conferma una forza rialzista persistente. Si verifica quando tutti i calcoli ricorsivi di forza relativa indicano valori sostenuti sopra l'equilibrio, suggerendo un forte slancio verso l'alto. La zona di trading rialzista aiuta i trader a identificare potenziali punti di ingresso long e aree di supporto dinamico dove il prezzo potrebbe continuare a salire.
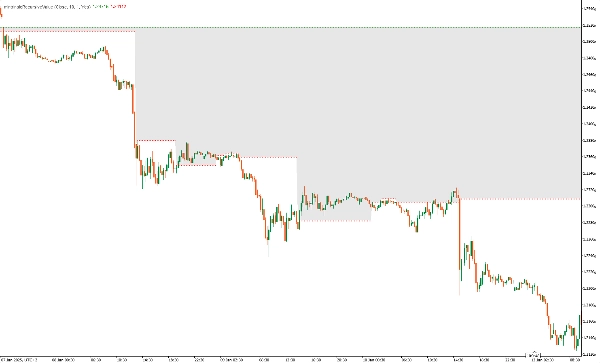
- Zona di Trading Ribassista: Questa zona si stabilisce quando il valore ricorsivo intrinseco identifica una forza ribassista continua. Quando tutti i valori ricorsivi di forza relativa sono sotto l'equilibrio, segnala un trend discendente in corso, offrendo ai trader opportunità per ingressi short e definendo livelli di resistenza dinamici dove il prezzo potrebbe continuare a diminuire.
Output dell'Indicatore
- outIntrinsicRecursiveLong : Mostra il livello long intrinseco quando viene rilevata una forza rialzista.
- outIntrinsicRecursiveShort: Mostra il livello short intrinseco quando viene rilevata una forza ribassista.
Utilizzo
- Conferma della Tendenza: Aiuta a identificare tendenze rialziste o ribassiste forti quando tutti i periodi di forza relativa sono allineati.
- Rilevamento di Inversione: Segnala potenziali punti di svolta quando il valore intrinseco cambia.
- Livelli di Supporto e Resistenza: I valori intrinseci agiscono come livelli dinamici di supporto e resistenza.
Esempio di Strategia di Trading
- Ingresso Long: Entra in una posizione long quando il livello long intrinseco è stabilito e l'azione del prezzo conferma lo slancio rialzista, questo significa che il prezzo è sopra il valore di equilibrio (componente verde dell'indicatore).
- Ingresso Short: Entra in una posizione short quando il livello short intrinseco è stabilito e l'azione del prezzo conferma lo slancio ribassista, questo significa che il prezzo è sotto il valore di equilibrio (componente rossa dell'indicatore).
- Strategia di Uscita: Usa trailing stop o la scomparsa dei livelli intrinseci per uscire dalle operazioni
Note
- L'indicatore è progettato per strategie di trend-following e funziona meglio in mercati con tendenza.
- Può essere combinato con altri indicatori come indicatori di momentum per confermare l'attivazione del trade.
Conclusione
L'Indicatore di Valore Ricorsivo Intrinseco è uno strumento potente per i trader che cercano di migliorare l'analisi delle tendenze utilizzando calcoli ricorsivi di forza relativa. Identificando livelli chiave di prezzo con tendenze ad alta probabilità, questo indicatore fornisce preziose informazioni sulla direzione del mercato e sulle potenziali opportunità di trading.
Riepilogo
The indicator defines Bullish and Bearish Trade Zones: the Bullish Trade Zone signals sustained upward momentum when all recursive strength values exceed equilibrium, suggesting potential long entry points and dynamic support levels. Conversely, the Bearish Trade Zone indicates ongoing downtrends when values fall below equilibrium, identifying short entry opportunities and dynamic resistance levels.
Outputs include intrinsic long and short levels that display when bullish or bearish strength is detected. Use cases encompass trend confirmation, reversal detection, and identification of dynamic support and resistance levels. An example strategy involves entering long trades when intrinsic long levels align with bullish price action and short trades when intrinsic short levels coincide with bearish momentum, with exits managed via trailing stops or disappearance of intrinsic levels.
Designed primarily for trend-following strategies in trending markets, this indicator can be combined with other momentum tools for trade confirmation.


