
الوصف
🔍 يفحص بيانات الحجم على مدى فترة تاريخية محددة، مبرزًا المناطق المحتملة التي قد يواجه فيها المستثمرون ذوو الرافعة المالية العالية عمليات تصفية، مما يوفر رؤى قيمة حول سلوك السوق.
ماذا يفعل هذا المؤشر؟
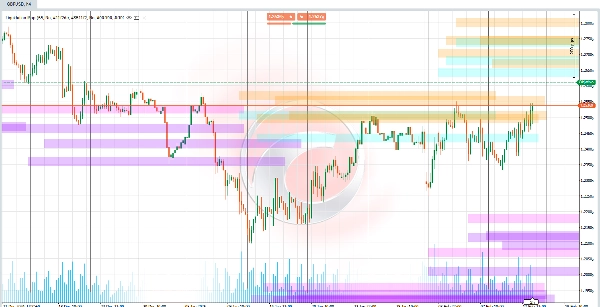
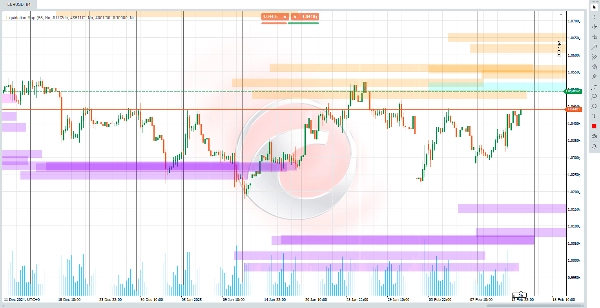
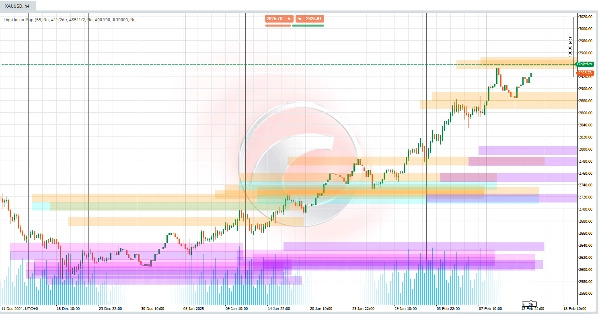
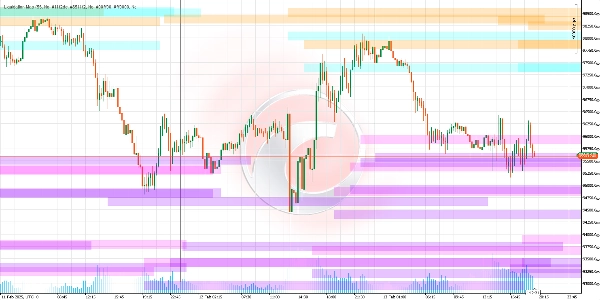
تحدد هذه الخوارزمية مستويات الأسعار حيث تحدث عمليات تصفية ضخمة للمراكز ذات الرافعة المالية (مثل 5x، 10x، 25x، 50x، أو 100x) من المرجح أن تحدث. تعمل هذه المستويات كـ "مغناطيس" لتحركات السعر، حيث يمكن أن تؤدي عمليات التصفية إلى تقلبات حادة في السوق. يرسم المؤشر خطوطًا أفقية على الرسم البياني، تمثل هذه العتبات ويتوقعها للمستقبل لتوقع مناطق الاهتمام الرئيسية.
كيف يتم حساب هذه المستويات؟
- كشف نقاط التحول السعرية:
🔄 يحدد القمم والقيعان الأخيرة في الرسم البياني (النقاط التي يتغير فيها اتجاه السعر). هذه النقاط هي الأساس لحساب مستويات التصفية. - الحجم كمحفز:
📊 يقارن الحجم الحالي بالمتوسط التاريخي. إذا تجاوز الحجم عتبات معينة (مثل 1.2x المتوسط لـ 100x)، فإنه ينشط مستويات التصفية المقابلة. - صيغة التصفية:
كلما زادت الرافعة المالية، كان مستوى التصفية أقرب إلى السعر الحالي. -
- لـ المراكز الطويلة: يتم تعيين مستوى التصفية أسفل القيعان المحورية، محسوبًا بناءً على الرافعة المالية (مثل 2% أسفل لـ 50x).
- لـ المراكز القصيرة: يتم تعيين المستوى أعلى القمم المحورية، باستخدام نفس المبدأ.
ماذا يمكنك أن تتوقع عند استخدامه؟
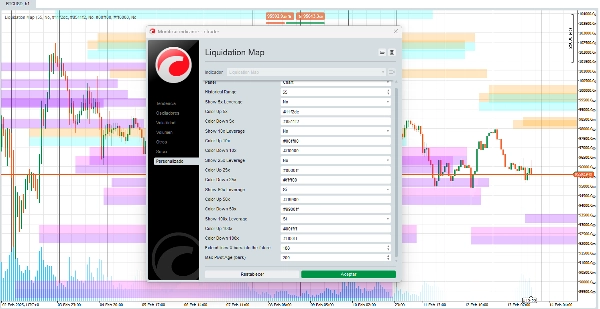
- خطوط السيولة: 🎨 سترى خطوطًا أفقية قابلة للتخصيص تمثل مناطق قد يشهد فيها السوق تقلبات عالية بسبب عمليات التصفية.
- الرافعات المالية القابلة للتكوين: ⚙️ يمكنك تمكين/تعطيل المستويات لكل نوع من الرافعات المالية (مثل التركيز فقط على 50x و 100x).
- تخصيص الألوان: 🌈 يمكنك اختيار اللون لكل نطاق تصفية، مما يكيف العرض البصري حسب تفضيلاتك.
- مناطق الازدحام: 🎯 تشير الخطوط المتعددة المتقاربة إلى مناطق عالية المخاطر/المكافأة حيث يمكن أن تحدث عمليات تصفية متعددة في نفس الوقت.
كيف تفسر الإشارات؟
- اقتراب السعر من خط: 🚨 إذا اقترب السعر من مستوى التصفية (خاصة مع حجم مرتفع)، تزداد احتمالية حدوث حركة حادة.
- اللون والشفافية: 🎨 تختلف الألوان حسب الرافعة المالية (مثل الأزرق لـ 25x، البرتقالي لـ 50x). تشير الشفافية إلى "قوة" الحجم المرتبط (الخطوط الداكنة = حجم أكبر).
لماذا هو مفيد؟
- التنبؤ الاستباقي: 🔮 لا يحلل الماضي فقط؛ بل يتوقع المستويات المستقبلية بناءً على الظروف الحالية.
- التركيز على نفسية السوق: 🧠 غالبًا ما تخلق عمليات التصفية القسرية ردود فعل متسلسلة (مثل أوامر وقف الخسارة التي تؤدي إلى المزيد من عمليات البيع). يساعدك هذا المؤشر على توقعها.
- التخصيص: 🛠️ قم بتكييف العرض البصري مع استراتيجيتك (مثل إعطاء الأولوية للرافعات المالية الأعلى في الأسواق المتقلبة).
القيود التي يجب مراعاتها
- اعتماد على الحجم: 📉 إذا كان الحجم منخفضًا أو كانت البيانات التاريخية غير كافية، قد تكون الإشارات أقل موثوقية.
- ليس كرة بلورية: 🔮 تشير المستويات إلى مناطق محتملة، وليست مؤكدة. دائمًا ما يجب دمجه مع تحليلات أخرى.
- بيئة ديناميكية: 🌍 في الأسواق التي تشهد أخبارًا غير متوقعة، يمكن أن تحدث عمليات التصفية خارج المستويات المتوقعة.
مؤشرات متجر Ctrader:
هيكل السوق الديناميكي
تحليل نقاط التحول
فيبوناتشي الخطي
الانحدار متعدد الأطر الزمنية
انحياز الشمعة متعدد المستويات
المتعقب
الملخص
تقييمات العملاء
5 | 67 % | |
4 | 0 % | |
3 | 33 % | |
2 | 0 % | |
1 | 0 % |


