

present
가입하고 첫 구매 시 $50 할인을 받으세요
Trading product for Hyper Trend PRO 지표 ADX EMA, image 1
Hyper Trend PRO
지표
버전 1.0, Sep 2026
Windows, Mac
Trading product for Hyper Trend PRO 지표 ADX EMA, image 2
Trading product for Hyper Trend PRO 지표 ADX EMA, image 3
Trading product for Hyper Trend PRO 지표 ADX EMA, image 4
Trading product for Hyper Trend PRO 지표 ADX EMA, image 5
Trading product for Hyper Trend PRO 지표 ADX EMA, image 6
Trading product for Hyper Trend PRO 지표 ADX EMA, image 7
Trading product for Hyper Trend PRO 지표 ADX EMA, image 8
Trading product for Hyper Trend PRO 지표 ADX EMA, image 9
Trading product for Hyper Trend PRO 지표 ADX EMA, image 10
Trading product for Hyper Trend PRO 지표 ADX EMA, image 11

설명

Hyper Trend PRO does not just tell you the trend has turned. It tells you how much the rest of the chart agrees.

How a signal is made

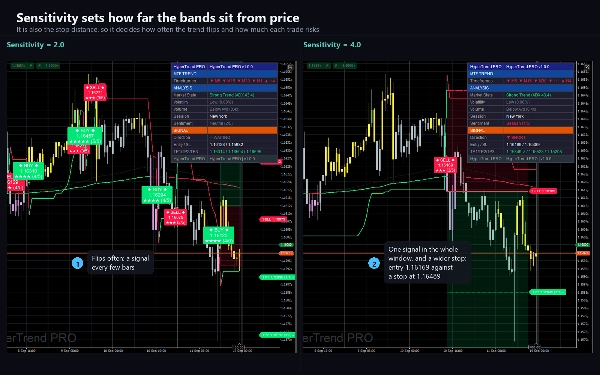
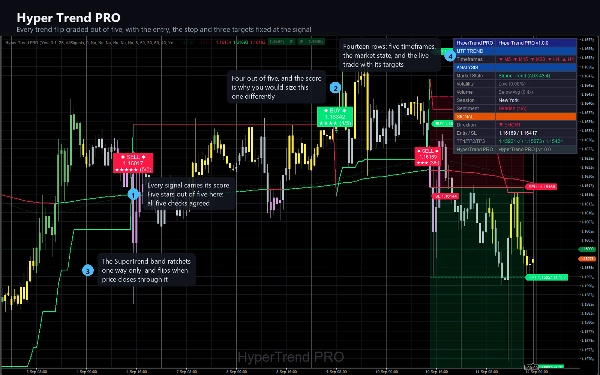
A SuperTrend built on the average true range marks the trend. Bands are placed above and below price at a multiple of a 25 bar ATR, each band ratchets one way only, and the trend flips when price closes through the band on the far side. Every signal begins as one of those flips and nothing else creates one.

The flip is then graded out of five. Five independent factors vote:

  • the MACD histogram, rising or falling against the previous bar
  • the 150 period EMA against the 250 period EMA
  • ADX above 20, so a flip inside a dead range is marked as one
  • volume against its own 20 bar average
  • the slope of a 55 period Hull moving average

The score is drawn on the signal as stars and as a number out of five, and named on the alert as Weak, Moderate or Strong. It is the difference between a flip that four other measures agree with and one that stands alone.

Choosing how selective it is

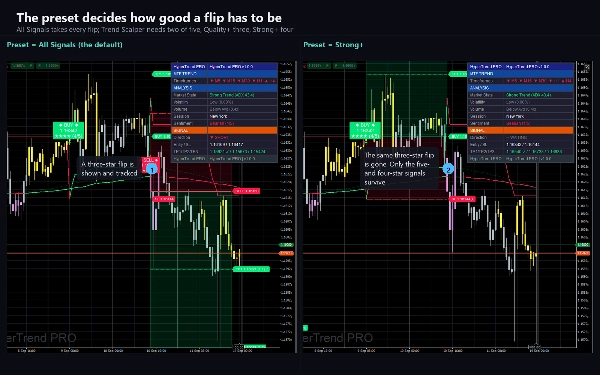
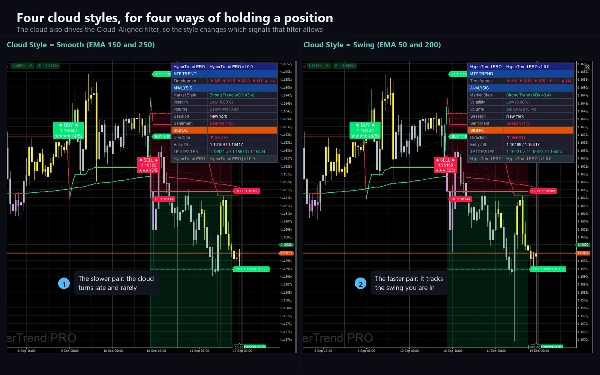
A preset sets the minimum score a flip must earn: All Signals takes everything, Trend Scalper needs two, Quality+ needs three and Strong+ needs four. Six further filters can each veto a signal on its own: trending markets only, strong scores only, above average volume only, aligned with the cloud only, and a contrarian mode that only takes a flip when a smoothed RSI is already stretched the other way. Every one of them is off until you turn it on.

The trade it draws

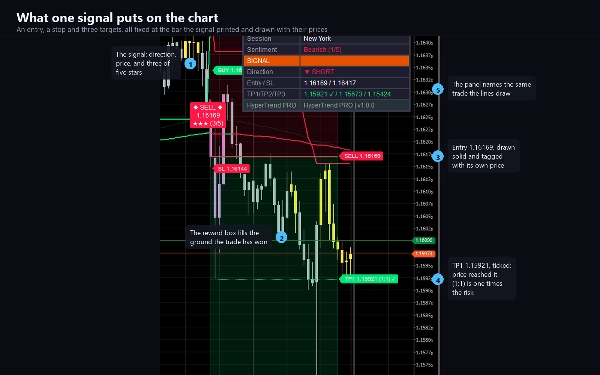
The moment a signal prints, the indicator fixes an entry, a stop and three targets and draws each one as a labelled line carrying its price.

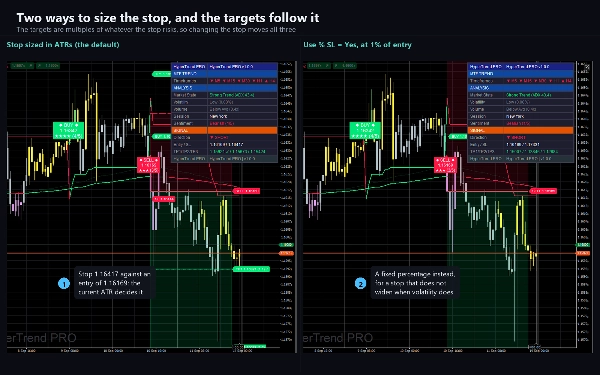
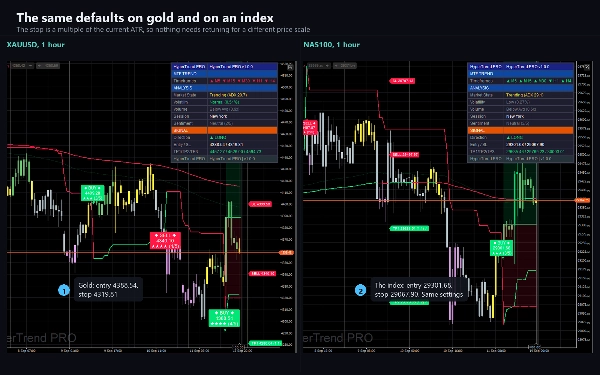
  • The stop is a multiple of the current ATR, so the same settings behave sensibly on a five minute chart and on a daily one, and on a currency pair and on gold. A fixed percentage stop is available instead.
  • The three targets are multiples of that same risk, so the defaults of 1.0, 2.0 and 3.0 are literally one, two and three times what you are risking.
  • Each target is ticked as price reaches it. Reaching the third target, or the stop, closes the tracked trade.
  • An optional ATR trailing stop is drawn behind an open trade.

What else is on the chart

  • A cloud between two moving averages, in four styles: a smooth EMA pair, two scalping variants and a swing pair.
  • A 250 period Trend Tracer line that changes colour with price.
  • Candles tinted through six steps according to how strong the MACD histogram is relative to volatility, so a weakening move is visible before it turns.
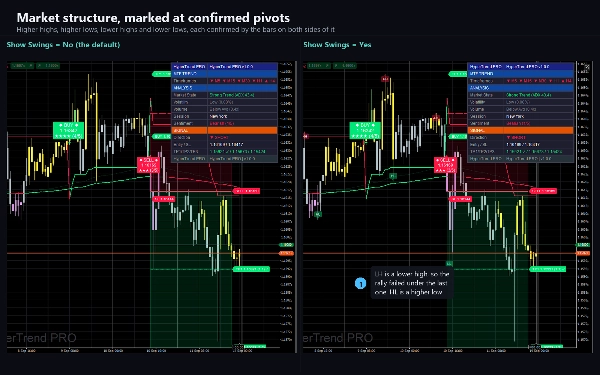
  • Optional market structure labels marking higher highs, lower highs, higher lows and lower lows.
  • Optional pullback markers from a WaveTrend oscillator, for re entry inside a trend rather than at its start.

The dashboard

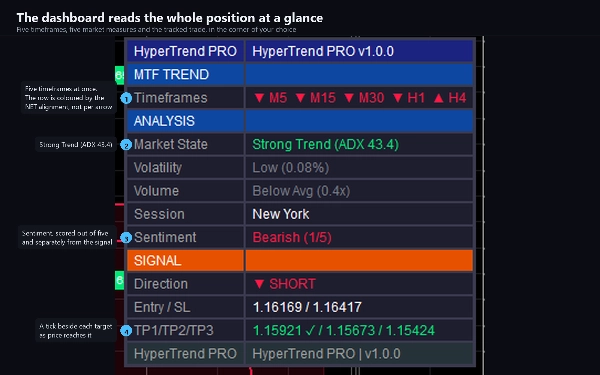
Fourteen rows in the corner of your choice. The top block reads five timeframes at once, M5 to H4, and shows which way each of them is leaning. Below it: the market state with its ADX, volatility as a percentage of price, volume against its average, the trading session, and a second five point score for overall sentiment. The bottom block is the last signal, its entry and stop, and its three targets with a tick beside each one that has been reached.

Alerts

Nine events, each behind its own switch: buy, sell, any signal, strong signal, the stop, the three targets and a trend change. Each fires once per closed bar and never for history, so attaching it to a long chart does not produce a wall of old alerts. Delivery is the cTrader log, an optional sound and optional e-mail through your own cTrader settings.

Settings

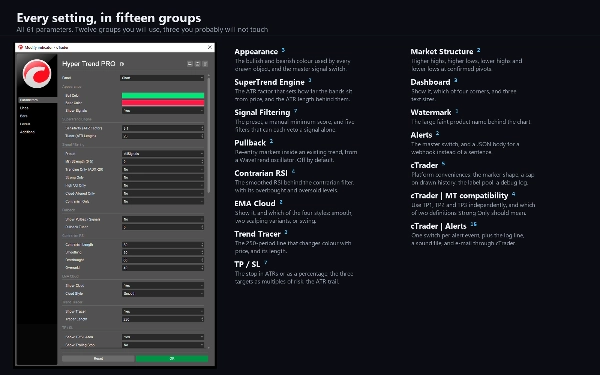
61 parameters in twelve groups you will use and three you probably will not touch. Appearance, the SuperTrend engine, signal filtering, pullback, contrarian RSI, the cloud, the tracer, risk, market structure, the dashboard, the watermark and alerts. The rest are cTrader conveniences: a marker style, an object cap, a debug log, three compatibility switches and one switch per alert event.

Type, timeframes and instruments

An overlay indicator for trend and momentum analysis. Its longest average is 250 bars, so it wants a chart with some history behind it; M15, H1 and H4 are the window it was designed around, and it runs on any timeframe. It has been checked on major currency pairs, on gold and on indices. It uses bars and volume: no tick data, no depth of market, no external data.

Who it is for

Traders who want a trend signal that comes with a grade rather than a yes or no, and who want the stop and the targets decided at the same moment as the entry rather than afterwards.

The trial

The trial edition is this same build with one restriction: it runs on EURUSD only, and broker suffixes such as EURUSD.i are accepted. There is no time limit and every parameter is available. The full version adds every other symbol.

Technical notes

Signals do not repaint. They are evaluated on closed bars only, so a marker never appears during a candle and then disappears when it closes. The cost of that is a one bar delay, and it is deliberate. While a trade is open its level lines and their labels extend to the right with the chart, which moves the drawing and not the levels.

The indicator declares no access rights. It opens no network connection, reads no file, and never places, modifies or closes an order. The ticks on the dashboard record that price touched a drawn level on the loaded history, with no spread, commission or slippage in them.

Support

Questions go through the Discussion tab of this listing. Please include your symbol, timeframe, broker, cTrader version and a screenshot with the dashboard visible.

Trading involves risk. Past performance does not guarantee future results.

요약

지표 프로필
지표 카테고리
추세
출력 유형
신호
시각화
데이터 요구 사항
거래량
지원되는 신호
크로스
추세 강도
반전

고객 리뷰

0.0
리뷰: 0
고객 리뷰
이 상품에 대한 리뷰가 아직 없습니다. 이미 사용해 보셨나요? 다른 사람들에게 가장 먼저 소개해 주세요!

상담

자주 묻는 질문(FAQ)

ADX
EMA
Key Levels
ATR
MACD
Moving Average
Support & Resistance
트레이딩 봇, 지표, 플러그인 등 cTrader Store에서 제공되는 상품은 제3자 개발자에 의해 제공되며, 이는 단순히 정보 및 기술적 접근을 목적으로 제공된 것입니다. cTrader Store는 중개인이 아니며, 투자 조언, 개인별 추천 또는 향후 성과에 대한 어떠한 보장도 제공하지 않습니다.

이 작성자의 상품 더 보기

지표
ATR
BOS
+5
Know how strong each Supertrend flip is: scored BUY/SELL, structure stop + 3 targets, live win-rate dashboard, alerts.
지표
ADX
ATR
+5
Scored breakouts of sloped pivot trendlines: four filters on the break bar, ATR stop, 1:1 / 1:2 / 1:3 targets, alerts.
지표
ATR
RSI
+5
Supply and demand zones with break of structure, higher timeframe MA signals, a percent stop and three targets.
지표
ATR
Volume
+3
Fibonacci trend signals on closed bars, with an ATR stop, up to four targets and a break-even ladder.
지표
ADX
ATR
+5
Ten confluence layers scored on every closed bar, with an anti-chop gate, pivot levels and a live dashboard.
지표
Volume
Channel
+3
A higher-timeframe log-regression channel with a volume profile, Point of Control and session levels.
지표
Volume
Key Levels
+1
Fixed-grid volume profile: bull and bear volume at every price level, with Point of Control and value area.

좋아하실 만한 다른 항목

지표
Indices
Custom ADX Indicator for precise trend analysis. المؤشر المخصص ADX لتحليل الاتجاه بدقة
지표
SMC
Prop
+13
Institutional FVG detection with HTF projection, precise volume deltas, and smart fill logic.
지표
Signal
Fractal Arrow Buy and Sell Indicator
지표
ATR
RSI
+5
Supply and demand zones with break of structure, higher timeframe MA signals, a percent stop and three targets.
지표
AI
Grid
+17
Clean 3D, Sleek Candles for Trend Patterns.
지표
CHOCH
Key Levels
+4
Real-time compliance dashboard for prop firm challenges. Tracks daily loss, max drawdown, and profit target.
지표
Signal
Scalping
Average accuracy of around 60% to 70% on 45min timeframes it is highly recommended to use stop losses
지표
Block Liquidity,indicator.Block Order, Liquids Stops, Signal Sentiment,signal correctio.
지표
Plot higher-timeframe Bollinger Bands for clearer structure, pullback zones, and breakout signals—without switching char
지표
MACD
Prop
+14
Enhance MACD Histogram! Visualize bull and bear price changes with vibrant colors for clearer, more insightful trading.
지표
Key Levels
Order Block
+5
Pixel-perfect trading zones in a click! Instantly draw, resize & color via hotkeys. Automate your charting routine
지표
ATR
RSI
+17
Turn data into precision trades with AlphaTrend Pro Max — advanced trend, signal & structure analysis in one.
지표
Prop
Forex
+4
A precision-crafted indicator that compares current volume to its historical average for the same time of day.
지표
ATR
RSI
+7
Identify bullish and bearish Order Blocks to spot key support/resistance levels and potential trend reversals! 📈🔄
"ZigXRay" 로고
최고 평점
4.6
(5)
$29
/
$49
지표
CHOCH
Key Levels
+5
ZigZag Market Structure Identifier - Multi-Layer Scanner: Convergent Pivot Detection, 4-TF Overlay & Naked Chart Mode.
지표
Volume
Key Levels
+1
Fixed-grid volume profile: bull and bear volume at every price level, with Point of Control and value area.
지표
Forex
BTCUSD
+5
Simple ICT Concepts
지표
Prop
Forex
+12
Identify and trade breakouts with Consolidation Zones! Visualize price consolidation areas for trading opportunities.

가격



























