
QX MatrixHybrid
Chỉ báo
Phiên bản 1.0, Feb 2026
Windows, Mac
4.6
Đánh giá: 3
Mô tả
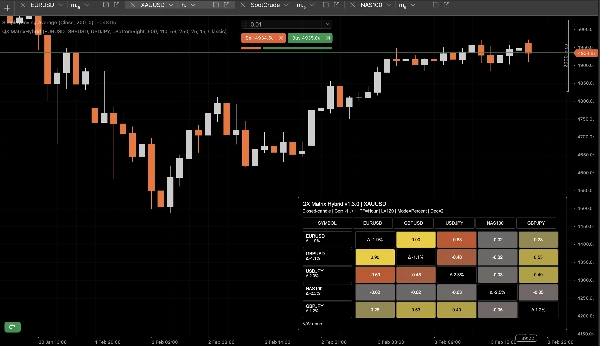
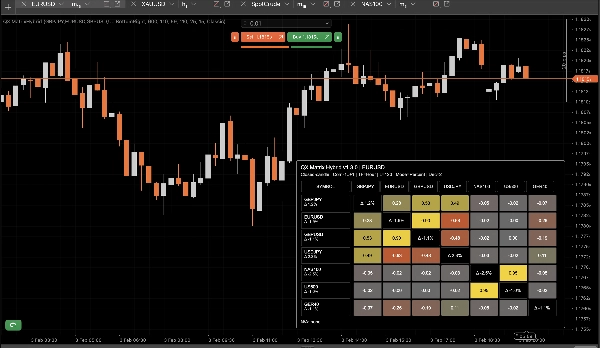
QX Matrix Hybrid là một chỉ báo trực quan hiển thị ma trận tương quan đa tài sản >dưới dạng bảng heatmap sạch sẽ. Nó giúp bạn nhanh chóng xác định các công cụ di chuyển cùng nhau, di chuyển ngược chiều, và nơi bạn có thể vô tình nhân đôi mức độ tiếp xúc trên các thị trường.
Các tính năng chính
- Ma trận tương quan (-1 đến +1) sử dụng tương quan Pearson giữa các ký hiệu.
- Chế độ lợi nhuận:
-
- Lợi nhuận phần trăm
- Lợi nhuận logarit
- Độ mạnh (Δ%) mỗi ký hiệu: hiển thị hiệu suất của từng ký hiệu trong khoảng thời gian nhìn lại (trong nhãn hàng và tùy chọn trên đường chéo).
- Tự động tương phản văn bản: màu văn bản thích ứng với độ sáng nền để dễ đọc.
- Chủ đề + Bảng màu tùy chỉnh: nhiều cài đặt trước cùng với bộ chọn màu tùy chỉnh đầy đủ.
- Bố cục bảng linh hoạt: gắn góc, chiều rộng, kích thước ô, lề, điều khiển chiều cao hàng.
- Chân trang thông minh: liệt kê các ký hiệu thiếu/không có với khả năng cắt ngắn cấu hình được.
Hiệu suất & logic cập nhật
Được xây dựng để duy trì phản hồi ngay cả với nhiều ký hiệu:
- Bộ nhớ đệm theo ký hiệu của các đối tượng Symbol và Bars để tránh gọi API lặp lại.
- Tự động vô hiệu hóa bộ nhớ đệm khi Symbols CSV hoặc TimeFrame thay đổi.
- Chế độ Chỉ Nến Đóng để giảm tải CPU (cập nhật khi có thanh đóng mới).
- Tùy chọn Giới hạn Cập nhật (ms) cho chế độ trực tiếp.
Cách sử dụng
- +1.00: đồng chuyển động tích cực mạnh (độ dư thừa cao).
- 0.00: mối quan hệ thấp (đa dạng hóa tiềm năng).
- -1.00: mối quan hệ ngược chiều mạnh (có thể phòng ngừa rủi ro).
Sử dụng ma trận để giảm sự chồng chéo tương quan, tìm cặp phòng ngừa rủi ro, và hiểu các “cụm” thị trường trên FX, chỉ số, kim loại, tiền điện tử, v.v.
Các tham số (cấp cao)
- Symbols CSV, TimeFrame, Lookback
- Chế độ lợi nhuận (Phần trăm/Log), Số thập phân, Tự động thập phân trên Log
- Chỉ Nến Đóng, Giới hạn Cập nhật
- Hiển thị Độ mạnh (Δ%), Hiển thị Chân trang, Số lượng tối đa thiếu ở chân trang
- Bố cục bảng (góc, chiều rộng, kích thước ô, lề)
- Màu sắc / Chủ đề (bao gồm bảng màu tùy chỉnh)
Ghi chú
- Chỉ để trực quan hóa. Không đặt lệnh.
- Các ký hiệu có thể hiển thị N/A nếu không có sẵn trên nhà môi giới/máy chủ của bạn hoặc nếu không có đủ lịch sử cho khung thời gian/độ dài nhìn lại đã chọn.
Tóm tắt
Tóm tắt AI
QX MatrixHybrid is a real-time visual indicator that presents a multi-asset correlation matrix as a heatmap panel. It displays Pearson correlation coefficients ranging from -1 to +1 between up to 12 selected symbols, helping users identify strong positive correlations, inverse relationships, and low correlations for diversification or hedging purposes. The indicator supports multiple return modes, including percent and log returns, and tracks each symbol’s performance over a configurable lookback period, showing strength as percentage change.
The interface offers full customization with multiple color themes and a custom palette, adjustable panel layout options (such as docking, cell size, and margins), and automatic text contrast for readability. It includes a smart footer that lists missing or unavailable symbols with configurable truncation.
Performance optimizations include per-symbol caching to reduce API calls, automatic cache invalidation on symbol or timeframe changes, and a "Closed Candle Only" mode to minimize CPU load by updating only on new closed bars. An optional update throttle controls live update frequency.
QX MatrixHybrid is designed for use across various markets including forex, indices, commodities, metals, and cryptocurrencies. It is a visualization tool only and does not place orders. Symbols may show as unavailable if data is insufficient or missing.
Hồ sơ chỉ báo
Đánh giá của khách hàng
4.6
Đánh giá: 3
5 | 67 % | |
4 | 33 % | |
3 | 0 % | |
2 | 0 % | |
1 | 0 % |
Đánh giá của khách hàng
February 12, 2026
The part that matters is bad ideas get easier to avoid, and 20 signals is a fair first sample.
February 9, 2026
Two sessions say more than one clean chart, and weak ideas are easier to skip.
February 5, 2026
Ngl, weak ideas are easier to skip and that is enough to keep testing it. Price action still has to agree.
Thảo luận
Câu hỏi thường gặp
Signal
Indices
Commodities
GBPUSD
RSI
Bollinger
Fibonacci
Scalping
AI
XAUUSD
NAS100
MACD
BTCUSD
Forex
Breakout
EURUSD
NZDUSD
Martingale
Prop
ZigZag
Supertrend
Fair Value Gap
SMC
Crypto
Grid
Stocks
ATR
USDJPY
VWAP
Các sản phẩm có sẵn trên cTrader Store, bao gồm bot giao dịch, chỉ báo và plugin, được cung cấp bởi các nhà phát triển bên thứ ba và chỉ nhằm mục đích cung cấp thông tin và tiếp cận kỹ thuật. cTrader Store không phải là nhà môi giới và không cung cấp lời khuyên đầu tư, khuyến nghị cá nhân hay bất kỳ đảm bảo nào về hiệu suất trong tương lai.


![Logo "Gaussian Channel [Iridio Capital]"](https://cdn.ctrader.com/image/webp/7c039209-5573-4a54-a072-f9528b503103_41960)


Giá
41.97M
Khối lượng đã giao dịch
208.53K
Pip đạt được
13
Lượt bán
354
Cài đặt miễn phí