
Description
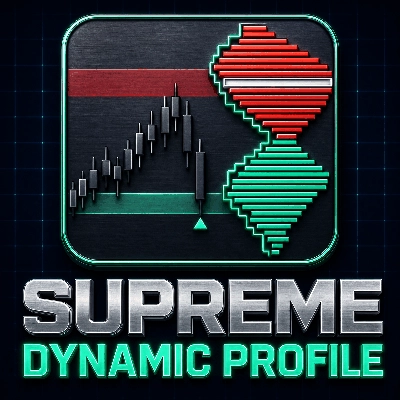
Supreme Dynamic Profile builds a volume profile of the most recent bars and turns it into a set of key levels.
It finds the point of control, the value area and the volume peaks and troughs of the profile, keeps
them on the chart as zones and lines, and marks every bar where price breaks one, rejects one or
comes back to retest one. A metrics table sums up where price stands against the profile.
WHAT IT DRAWS
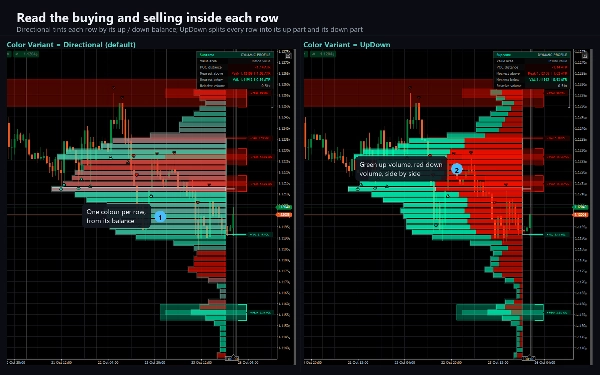
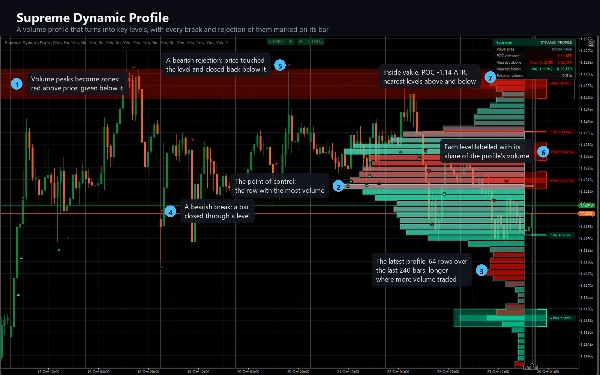
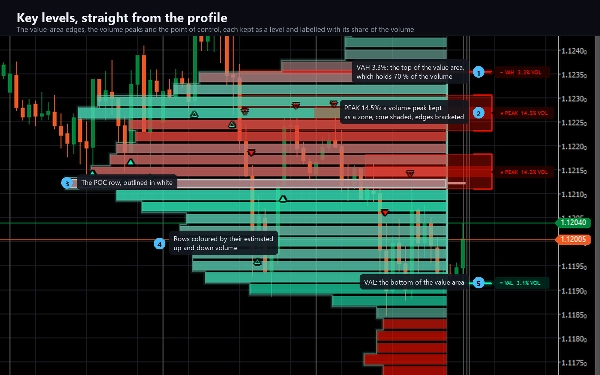
- The latest volume profile: one horizontal row per price band, longer where more volume traded,
coloured by its estimated up and down volume, with an outline and ticks at the point of control
(POC), the value-area high (VAH) and the value-area low (VAL).
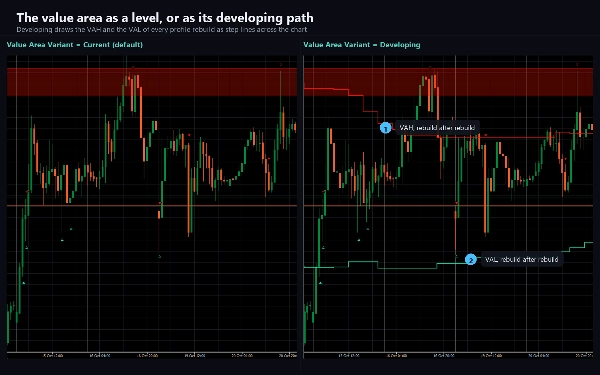
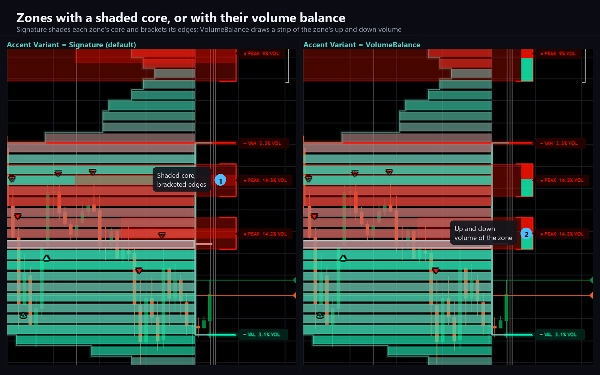
- Key levels: the VAH and VAL lines, volume peaks drawn as zones, ranked high-volume rows as lines,
and optionally the POC, volume troughs and the lowest-volume rows. A level is green while price is
above it and red while price is below it, so support and resistance read at a glance.
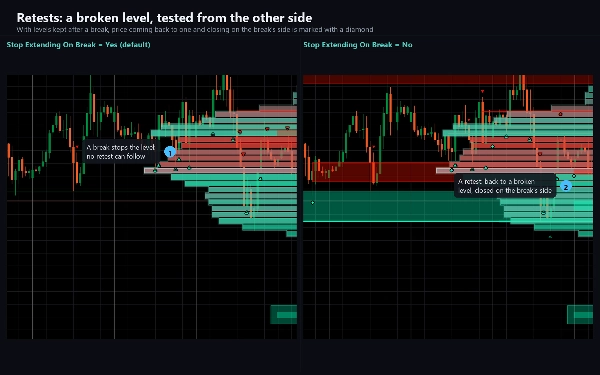
- Signal markers: a filled triangle for a break, a hollow triangle for a rejection, a diamond for a
retest, under the bar for bullish signals and over it for bearish ones.
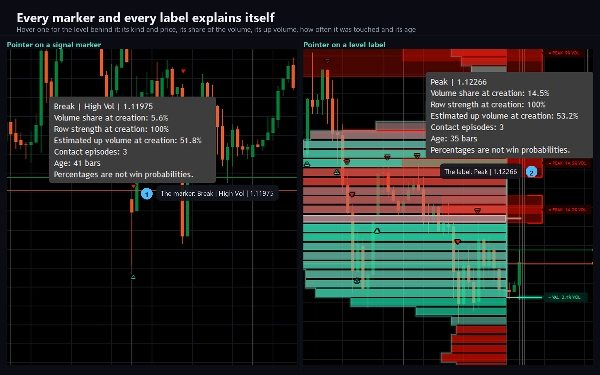
- Level labels in one column beside the profile: the level's name and its share of the profile's
volume. Hover a label or a marker for the full details: price, volume share, row strength, up volume,
how often it was touched and its age.
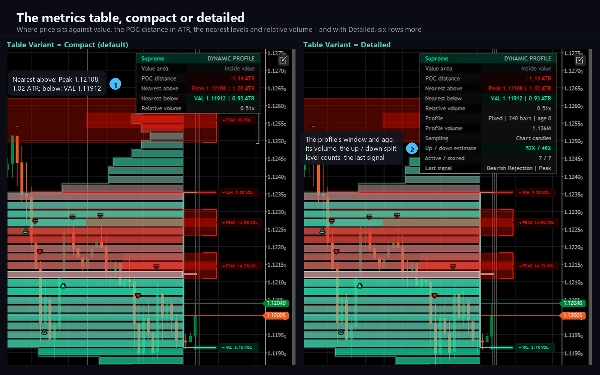
- The metrics table: price inside, above or below value, the distance to the POC in ATR, the nearest
level above and below, and relative volume. A detailed variant adds the profile's window, volume,
up and down split, level counts and the last signal.
HOW IT DECIDES
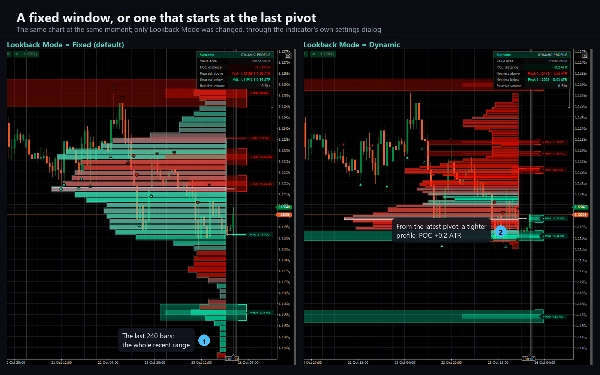
The profile covers the last 240 bars, or, in dynamic mode, the bars since the latest confirmed pivot
high or low. Its price range is split into 64 rows, and each bar's volume is spread over the range it
covered; a lower-timeframe option places the volume more precisely. The POC is the row with the most
volume, and the value area grows out from it until it holds 70 % of the volume.
Every fifth closed bar the profile is rebuilt. Its POC, value-area edges, peaks, troughs and ranked
rows become levels; a node that is already on the chart is kept as it was, and a new one that would
overlap an existing node is skipped. A level stops when a bar closes through it or after 500 bars.
On each closed bar every level is checked. A break is a close on the other side of the level. A
rejection is a touch of the level followed by a close back on the side price came from. A retest means a
return to a broken level within 30 bars that closes on the break's side; it needs levels to stay active
after a break, which is one switch. A cooldown and an optional relative-volume filter choose which
signals count, and one marker per direction per bar is drawn, a break first.
Everything is decided when a bar closes. A level, a marker or a signal never changes once made; the
latest profile is redrawn as new bars arrive, by design.
KEY SETTINGS
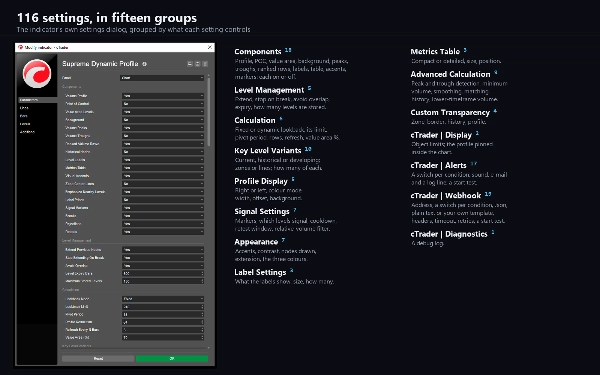
116 settings in fifteen sections: which components to draw; how levels are kept, stopped and stored;
the lookback, pivot period, profile resolution, refresh and value-area share; the variant of each
level family (current, historical or a developing path; zones or lines; how many); the profile's
placement, colour mode, width and offset; the signal filters; contrast, colours and labels; the table;
detection and smoothing; transparency; and groups for display, alerts, the webhook and diagnostics.
ALERTS AND WEBHOOK
Nine conditions, each with its own switch: a new key level, and a bullish and a bearish break,
rejection and retest, plus any bullish or any bearish signal. Delivered as a log line, a sound of your
choice and e-mail, and a test on start checks your settings without waiting for a signal. Nothing fires
while the indicator walks the chart's history, and nothing fires in a backtest.
A webhook posts the same nine conditions, each with its own switch, to any address you enter: a chat
bot, a journal, an automation flow or your own server. Choose a JSON body with the bar, the POC, VAH
and VAL, relative volume and every level that fired, the plain alert sentence, or your own template
with eighteen placeholders. Add an authorisation header and one more header of your own. A post that
gets no success answer is sent again, and a test on start checks the address. It stays off until you
enter one, is sent once per condition per bar, is capped at twenty messages a minute, and a failure is
logged rather than thrown. It sends through cTrader's own networking service, which is why the
indicator needs no file or network access rights at all.
TYPE AND WINDOW
An overlay indicator: everything is drawn on the price chart, and it adds no separate pane. cTrader
leaves little room past the last bar, which is why the profile and its labels are pinned inside the
chart by default while the last bar is in view; one switch places them at their designed spot past the last bar.
TIMEFRAMES AND INSTRUMENTS
Any timeframe from one minute to daily and any instrument with volume. The profile is built from the
chart's own bars and volume, and prices are written to your broker's own tick. When it attaches, the
indicator loads at least 5,000 bars of the chart's history so the levels have a past to build on.
USE CASES
- Seeing where the volume of the recent range traded, and where it did not.
- Marking the POC, the value area and the volume peaks as zones to watch.
- Reading a break, a rejection or a retest of a level the moment the bar closes.
- Checking at a glance if price trades inside, above or below value.
- Being told by log line, sound, e-mail or webhook when a level breaks or holds.
WHO IT IS FOR
Traders who work with volume profile, value areas and support and resistance, and want those levels
found and kept by fixed rules rather than drawn by hand, with the reaction at each level marked on the
bar it happened.
TECHNICAL NOTES AND LIMITATIONS
Access rights: none. The indicator cannot read files, start processes or open connections of its own.
It is a charting and analysis tool. It does not place orders and it has no access to your account.
The profile is built from your broker's volume, which on cTrader is tick volume, so another feed can
build other levels. The percentages on the labels describe the profile when a level was created; they
are not win probabilities. By default the chart keeps the newest 500 boxes, 500 lines and 500 labels,
so the oldest drawings retire on a long chart; a switch keeps all of them.
SUPPORT
Questions go through the Discussion tab. Include your broker, symbol, timeframe, cTrader version and
a screenshot of the full chart, and you will get a useful answer first time.
Trading involves risk. Past performance does not guarantee future results.
Summary
The indicator marks price action signals on the chart bars, including breaks, rejections, and retests of these key levels, using distinct shapes and positions to denote bullish or bearish signals. A metrics table summarizes the price’s position relative to the profile, distances to key levels in ATR, and volume statistics.
Supreme Dynamic Profile supports any instrument with volume data on timeframes from one minute to daily. It includes extensive customization with over 100 settings covering profile construction, level management, visual styles, and signal filtering. Alerts and webhook notifications are available for various level and signal events, enabling integration with external systems. The indicator operates without requiring special access rights and does not place trades.