
FVG_Bruno
Indikator
Version 1.0, Oct 2025
Windows, Mac
4.0
Bewertungen: 2
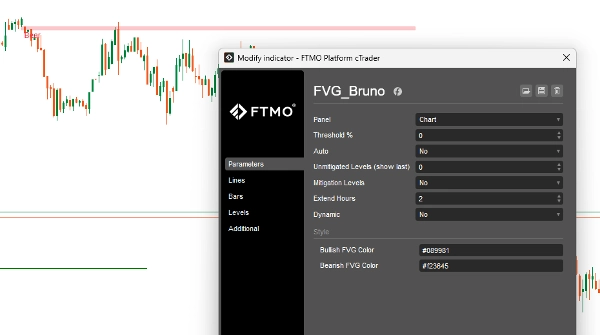
Beschreibung
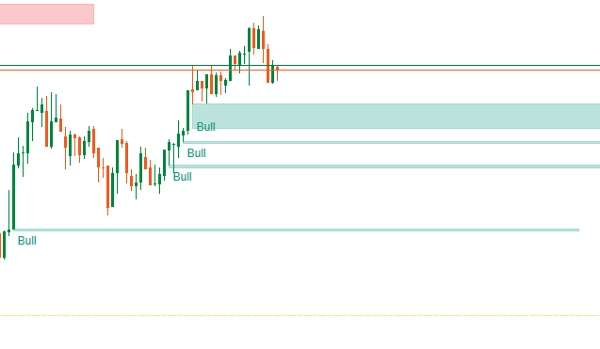
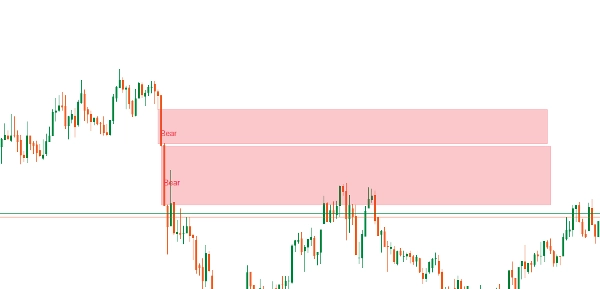
Ein FVG ist ein Preisungleichgewicht, das auftritt, wenn sich der Markt aggressiv in eine Richtung bewegt und eine Lücke zwischen aufeinanderfolgenden Kerzen hinterlässt. Diese Lücke stellt einen Bereich dar, in dem die Liquidität nicht vollständig ausgetauscht wurde, und der Preis besucht diesen Bereich oft später erneut, um das Ungleichgewicht zu „füllen“.
Zum Beispiel:
- Bei einer bullischen Bewegung, wenn Kerze 1 schließt und Kerze 3 weit über dem Hoch von Kerze 1 öffnet, wodurch das Tief von Kerze 2 ungetestet bleibt, ist diese Lücke ein FVG.
- Trader erwarten, dass der Preis in diese Lücke zurückkehrt, bevor der Trend fortgesetzt wird.
Zusammenfassung
Indikatorprofil
Kundenbewertungen
4.0
Bewertungen: 2
5 | 0 % | |
4 | 100 % | |
3 | 0 % | |
2 | 0 % | |
1 | 0 % |
Diskussion
Häufig gestellte Fragen (FAQ)
BTCUSD
Forex
Signal
Indices
EURUSD
Commodities
GBPUSD
NZDUSD
Prop
Fair Value Gap
Crypto
Stocks
XAUUSD
NAS100
USDJPY
Über den cTrader Store verfügbare Produkte, einschließlich Handelsbots, Indikatoren und Plugins, werden von externen Entwicklern bereitgestellt und nur zu Informations- und technischen Zugriffszwecken verfügbar gemacht. cTrader Store ist kein Broker und erbringt keine Anlageberatung, persönlichen Empfehlungen oder eine Garantie für zukünftige Performance.
Mehr von diesem Autor


Preis
Seit 22/10/2025
303.42M
Gehandeltes Volumen
49
Pip-Gewinn
1
Verkäufe