„EURUSD Breakout Indicator“-Logo
EURUSD Breakout Indicator
5.0
Bewertungen: 1
In „EURUSD Breakout Indicator“ hochgeladenes Bild
Seit 21/02/2025
461.42M
Gehandeltes Volumen
178.3K
Pip-Gewinn
10
Verkäufe
5.75K
Kostenlose Installationen

This Indicator can be used on any Forex pair!


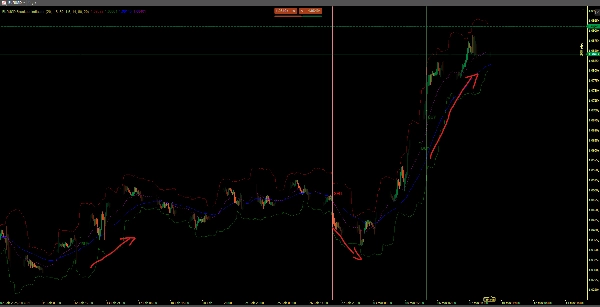
The EURUSD Breakout indicator is a comprehensive technical analysis tool designed for the 15M, 30M, 1H, 2H ...-Chart that identifies high-probability breakout trading opportunities using multiple confirmation methods.

This indicator generates buy and sell signals based on price breaking through calculated support and resistance levels, while requiring confirmation from:

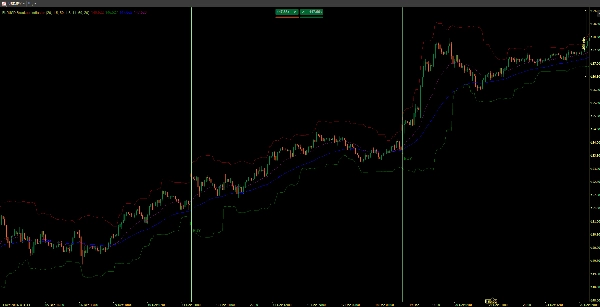
  1. Current timeframe trend (using a 50-period EMA)
  2. Higher timeframe trend alignment (using a 20-period EMA on a 1-hour chart)
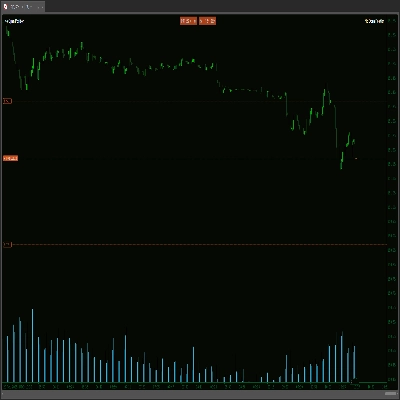
  3. Above-average volume (1.5x normal volume)
  4. Volatility-adjusted breakout levels (using ATR)

All signals are clearly displayed directly on the chart with color-coded markers and labels. The indicator is fully customizable with seven parameters to adjust sensitivity based on market conditions and trading preferences.

By requiring alignment between multiple timeframes and confirmation factors, this indicator produces fewer but higher-quality signals, helping to filter out false breakouts and identify stronger trading opportunities in the EURUSD pair.

Indicator profile
5.0
Bewertungen: 1
5
100 %
4
0 %
3
0 %
2
0 %
1
0 %
Kundenbewertungen
August 18, 2025
Pros: Simple and effective breakout zone visualization for EURUSD. Lightweight and stable. Works well for intraday setups. Cons: No alerts, MTF mode, or false breakout filters. Limited optimization for non-EURUSD pairs.
Products available through cTrader Store, including trading bots, indicators and plugins, are provided by third-party developers and made available for informational and technical access purposes only. cTrader Store is not a broker and does not provide investment advice, personal recommendations or any guarantee of future performance.

Mehr von diesem Autor

High-probability trading signals in the fast-paced world of forex and CFD trading.
High-Performance Renko Chart Indicator with Advanced filtering method.
This indicator combines RSI (Relative Strength Index) with volume analysis to generate more reliable trading signals.
Automatic Elliott Wave Detection with Professional Filters
The Renko Moving Average Cross indicator combines classic EMA crossover signals with Renko-filtered prices.
Enhance Your Trading Strategy with the Larry Williams 9-5-3 Indicator
Engulfing Pattern Indicator
MA-RSI HTF Confirmation: Eliminate false signals and trade with confidence!
🚀 Simplify Your Trading Decisions With Powerful Technical Analysis.
PinBarCandlestickPattern Indicator
Hammer Pattern Indicator
This custom indicator is a complete implementation of the Average Directional Index and Directional Indicators.

Das könnte Sie auch noch interessieren

Bollinger Bands Width
SectorIndex Dual Moving Average Indicator: Your Market Compass 🧭
IVT: A multi-symbol BOS scanner. Visual BULLISH/BEARISH chart labels with optional volume-filtered Telegram alerts.
The Break of Structure (BoSCHoCh) Indicator is a smart market structure tool designed to help traders easily spot trend.
Visual warning zones for high-impact news so you can manage risk before volatility hits.
TREND FALLOWING: Advanced technical indicator signal.
Professional position management! Calculate real-time pivots, monitor P&L & costs, and strengthen your strategy.
Customize color
REAL Supertrend because default Ctrader Supertrend gives different signals
Z-Score: Measures price deviations from its mean. Spots overbought/sold (±2-3 SD) & reversals. Key for stats trading
Advanced customizable volume-profile indicator with buy/sell levels, delta analysis, multi-TF support and vivid gradient
Identify potential reversal points in the market by detecting candles with exceptionally long upper or lower wicks
Future-AI indicator.
Trailing algo 📈 auto-tracks trends 🎯 adapts to volatility 🌟 precise moves 🛡️ retest signals 🚀 no lag, smart market
Map true market structure with logarithmic precision — see balanced ranges and swing alignment instantly.
MainChart_EMA_BB is a main‑chart overlay indicator for cTrader that combines:
Decision System Indicator According to Cosmic Laws
Chart control panel — zoom presets, timeframe selector, favorite chart buttons, chart type switcher, and bid/ask lines.
Seit 21/02/2025
461.42M
Gehandeltes Volumen
178.3K
Pip-Gewinn
10
Verkäufe
5.75K
Kostenlose Installationen