Beschreibung
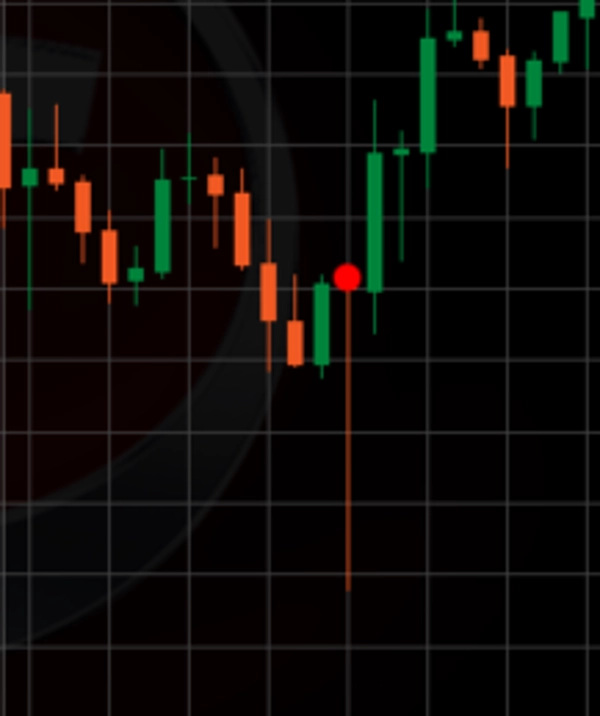
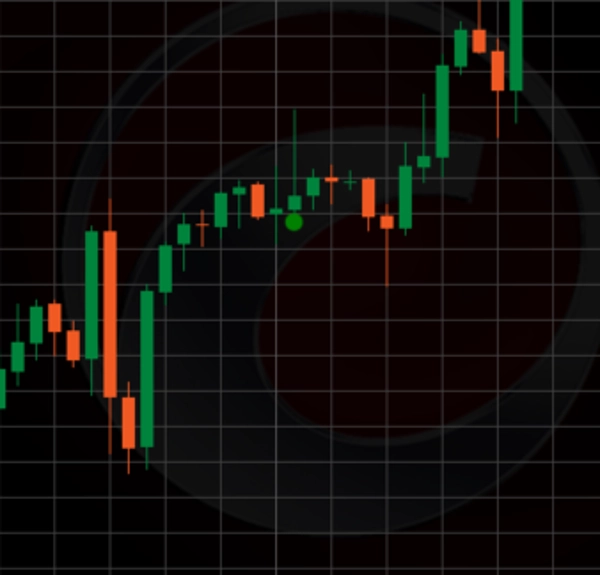
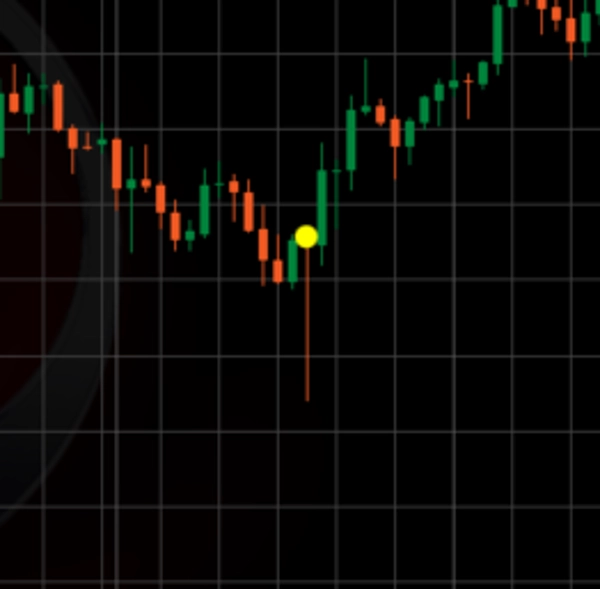
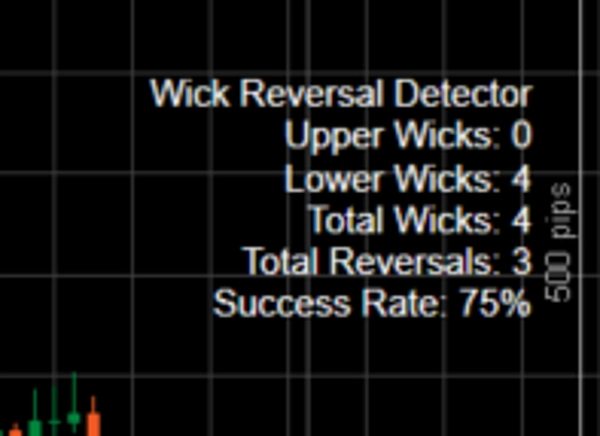
Der Long Wick Indikator ist ein leistungsstarkes Werkzeug der technischen Analyse, das für cTrader entwickelt wurde und sich darauf konzentriert, Kerzen mit ungewöhnlich langen Dochten – entweder oben oder unten – im Verhältnis zur Körpergröße und zur durchschnittlichen Kerzenreichweite zu identifizieren. Er hebt diese Dochte im Chart als potenzielle Umkehrpunkte hervor, an denen der Markt möglicherweise höhere Preise abgelehnt hat (bei oberen Dochten, was auf eine bärische Umkehr hindeutet) oder niedrigere Preise (bei unteren Dochten, was auf eine bullische Umkehr hindeutet). Der Indikator verwendet eine Kombination aus einem Docht-Schwellenwert-Multiplikator, einem minimalen Docht-zu-Körper-Verhältnis und einem trendfilternden Simple Moving Average (SMA), um Rauschen herauszufiltern und sich auf signifikante Preisabweisungsmuster zu konzentrieren. Jeder erkannte Docht wird mit einem Kreis markiert (grün für obere Dochte, rot für untere Dochte, wenn als Umkehr bestätigt, oder gelb, wenn nicht), und statistische Daten (z. B. Gesamtzahl der Dochte, Umkehrungen und Erfolgsrate) werden im Chart zur einfachen Nachverfolgung angezeigt.
Anwendung im Trading:
- Erkennen von Umkehrmöglichkeiten: Verwenden Sie den Indikator, um lange Dochte zu erkennen, die an wichtigen Unterstützungs- oder Widerstandsniveaus auftreten oder gegen den vorherrschenden Trend gerichtet sind (z. B. ein langer unterer Docht in einem Abwärtstrend für eine potenzielle bullische Umkehr). Ein solider grüner oder roter Kreis zeigt eine bestätigte Umkehr basierend auf der Kursbewegung innerhalb des Lookforward-Zeitraums an, was ein Signal sein kann, einen Trade in die entgegengesetzte Richtung in Betracht zu ziehen (z. B. Kauf bei einer roten unteren Docht-Umkehr, Verkauf bei einer grünen oberen Docht-Umkehr).
- Bestätigung mit anderen Werkzeugen: Kombinieren Sie den Long Wick Indikator mit anderen technischen Indikatoren (z. B. RSI, MACD oder Unterstützungs-/Widerstandslinien), um Umkehrsignale zu bestätigen und Fehlalarme zu vermeiden, insbesondere in unruhigen Märkten.
- Risikomanagement: Platzieren Sie Stop-Loss-Orders jenseits des Docht-Extremums (z. B. unter dem Tief bei einer bullischen Umkehr), um sich gegen das Risiko abzusichern, dass die Umkehr fehlschlägt, und setzen Sie Take-Profit-Niveaus basierend auf nahegelegenen Unterstützungs-/Widerstandsniveaus oder einem Risiko-Ertrags-Verhältnis (z. B. 1:2).
- Überwachung der Erfolgsrate: Überprüfen Sie regelmäßig die angezeigte Erfolgsrate, um die Wirksamkeit des Indikators im Zeitverlauf zu bewerten und Ihre Strategie entsprechend anzupassen.
Anpassung der Parameter für optimale Nutzung:
- Lookback-Periode (Standard: 5): Bestimmt die Anzahl der Balken, die zur Berechnung der durchschnittlichen Kerzenreichweite verwendet werden. Eine kürzere Periode (z. B. 3-10) macht den Indikator empfindlicher gegenüber jüngster Volatilität, ideal für schnelllebige Märkte, während eine längere Periode (z. B. 20-50) den Durchschnitt für trendigere Bedingungen glättet. Passen Sie dies basierend auf Ihrem Zeitrahmen an (z. B. niedriger für 1-Minuten-Charts, höher für 1-Stunden-Charts).
- Lookforward-Periode (Standard: 15): Legt die Anzahl der Balken fest, um eine Umkehr zu bestätigen. Eine kürzere Periode (z. B. 5-10) eignet sich für schnelle Scalping-Strategien, während eine längere Periode (z. B. 15-30) besser für Swing-Trading ist, um längere Umkehrungen zu erfassen. Erhöhen Sie diesen Wert, wenn Sie zu viele gelbe Markierungen bemerken, bei denen Umkehrungen später auftreten.
- Docht-Schwellenwert-Multiplikator (Standard: 1,3): Multipliziert die durchschnittliche Kerzenreichweite, um die minimale Dochtlänge festzulegen. Niedrigere Werte (z. B. 1,0-1,5) erkennen mehr Dochte (nützlich in Märkten mit geringer Volatilität), während höhere Werte (z. B. 2,0-3,0) nur die bedeutendsten Dochte filtern (besser in Märkten mit hoher Volatilität). Passen Sie dies an, um Empfindlichkeit und Signalqualität auszubalancieren.
- Trendperiode (SMA) (Standard: 21): Definiert die Länge des SMA für die Trendfilterung. Eine kürzere Periode (z. B. 10-20) reagiert auf kurzfristige Trends, während eine längere Periode (z. B. 50-100) mit längerfristigen Trends übereinstimmt. Passen Sie dies an Ihren Handelszeitraum und die Marktbedingungen an.
- Minimales Docht-zu-Körper-Verhältnis (Standard: 3): Legt das minimale Verhältnis von Dochtlänge zur Körpergröße fest. Ein niedrigeres Verhältnis (z. B. 2-3) schließt mehr Kerzen mit moderaten Dochten ein, während ein höheres Verhältnis (z. B. 4-5) sich auf Kerzen mit sehr ausgeprägten Dochten konzentriert. Erhöhen Sie es für strengere Umkehrsignale, verringern Sie es für mehr Gelegenheiten.
- Umkehr-Toleranz (Pips) (Standard: 5): Ermöglicht eine Toleranz in Pips, dass der Preis über das Docht-Extrem hinausgeht, bevor eine Umkehr disqualifiziert wird. Ein kleinerer Wert (z. B. 2-3) sorgt für eine strenge Umkehrbestätigung, während ein größerer Wert (z. B. 5-10) kleinere Rücksetzer zulässt. Passen Sie dies basierend auf dem Pip-Wert und der Volatilität des Symbols an.
Optimierungstipps:
- Beginnen Sie mit den Standardeinstellungen und testen Sie diese anhand historischer Daten für Ihr bevorzugtes Instrument und Ihren Zeitrahmen.
- Erhöhen Sie in Trendmärkten den Docht-Schwellenwert-Multiplikator und das minimale Docht-zu-Körper-Verhältnis, um sich auf stärkere Umkehrsignale zu konzentrieren.
- In Seitwärtsmärkten senken Sie diese Parameter, um mehr Dochte zu erfassen, kombinieren Sie dies jedoch mit einer kürzeren Lookforward-Periode, um späte Disqualifikationen zu vermeiden.
- Überprüfen Sie regelmäßig die Erfolgsrate und passen Sie die Parameter an, wenn sie unter Ihre akzeptable Schwelle fällt (z. B. 70%).
Durch die Anpassung dieser Parameter können Händler den Long Wick Indikator auf ihre spezifische Strategie zuschneiden und dessen Effektivität bei der Erkennung von Umkehrpunkten mit hoher Wahrscheinlichkeit unter verschiedenen Marktbedingungen verbessern.
Zusammenfassung
Traders can use the indicator to spot reversal opportunities at key support or resistance levels or against prevailing trends. It is recommended to confirm signals with other technical tools such as RSI or MACD and to apply risk management by placing stop-loss orders beyond wick extremes. The indicator’s parameters—including lookback and lookforward periods, wick threshold multiplier, SMA trend period, minimum wick-to-body ratio, and reversal tolerance—are adjustable to suit different market conditions and trading styles. Regular review of the success rate helps optimize performance.
Kundenbewertungen
5 | 0 % | |
4 | 100 % | |
3 | 0 % | |
2 | 0 % | |
1 | 0 % |