
FZ
Indicador
Versión 1.0, Mar 2026
Windows, Mac
4.0
Valoraciones: 2
Descripción
Indicador FZ para cTrader
Descripción
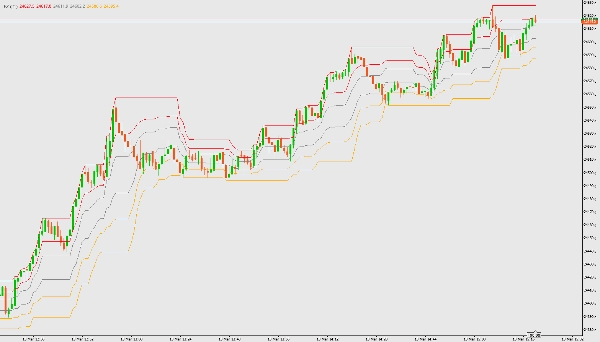
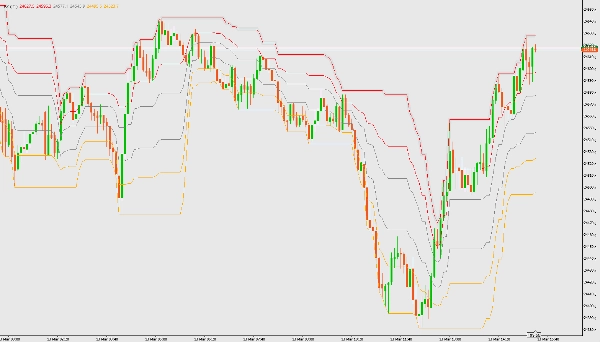
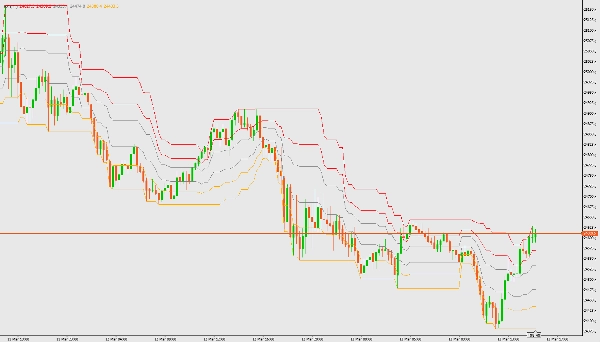
El indicador FZ dibuja zonas de canal de Fibonacci basadas en los precios más altos y más bajos durante un período definido por el usuario. Ayuda a identificar zonas de tendencia y posibles áreas de reversión.
Características
- Calcula los bordes del canal y los niveles de Fibonacci (0.236, 0.382, 0.618, 0.786)
- Visualiza zonas de tendencia alcista, lateral y bajista
- Superposición en el gráfico de precios
Parámetros
- calcular para las últimas ## barras: Número de barras a usar para el cálculo (por defecto: 21)
Cómo usar
- Descargue y agregue el archivo del indicador FZ (FZ.cs) a su plataforma cTrader.
- Compile el indicador en cTrader Automate.
- Adjunte el indicador a cualquier gráfico.
- Ajuste el parámetro para el número de barras según sea necesario.
- Interprete las zonas coloreadas:
-
- Cian: Zona de tendencia alcista (comprar)
- Gris: Zona lateral (esperar cambio de tendencia)
- Naranja: Zona de tendencia bajista (vender)
Resumen
Perfil del indicador
Valoraciones de clientes
4.0
Valoraciones: 2
5 | 0 % | |
4 | 100 % | |
3 | 0 % | |
2 | 0 % | |
1 | 0 % |
Conversación
Preguntas frecuentes
BTCUSD
Forex
Signal
Breakout
Indices
EURUSD
Commodities
GBPUSD
NZDUSD
Prop
Scalping
Crypto
Grid
Stocks
AI
XAUUSD
NAS100
USDJPY
Los productos disponibles a través de cTrader Store, incluidos bots, indicadores y plugins para operar, son proporcionados por desarrolladores de terceros y están disponibles únicamente con fines informativos y de acceso técnico. cTrader Store no es un bróker, por lo que no proporciona asesoramiento de inversión, recomendaciones personales ni ninguna garantía de rentabilidad futura.
Más de este autor


![Logotipo de "Smart Money Concepts (SMC) [Iridio Capital]"](https://cdn.ctrader.com/image/webp/28b69fd1-ef54-4bed-9487-07e78e883be4_40934)


![Logotipo de "Gaussian Channel [Iridio Capital]"](https://cdn.ctrader.com/image/webp/7c039209-5573-4a54-a072-f9528b503103_41960)


Precio
Desde 10/03/2026
105
Instalaciones gratis