
Deskripsi
IR Open Connector
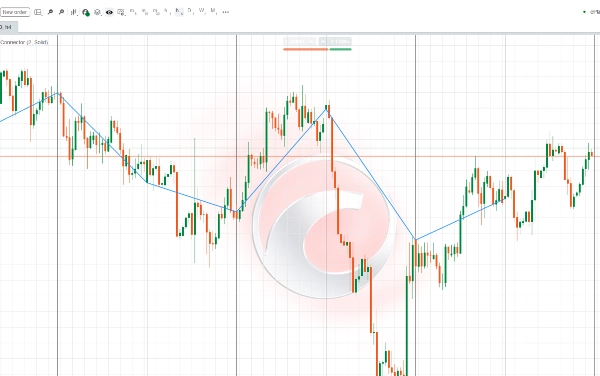
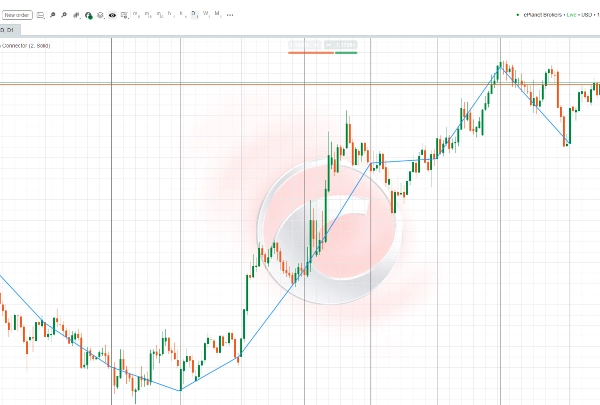
Indikator ini dirancang untuk menghubungkan harga pembukaan candle timeframe yang lebih tinggi, tergantung pada timeframe grafik saat ini:
- Jika timeframe di bawah satu jam → menghubungkan pembukaan candle Harian.
- Jika timeframe adalah 4 jam → menghubungkan pembukaan candle Mingguan.
- Jika timeframe lebih tinggi dari 4 jam tetapi lebih rendah dari Mingguan → menghubungkan pembukaan candle Bulanan.
Ini memungkinkan trader untuk dengan jelas memvisualisasikan level pembukaan utama dari periode yang lebih tinggi (Harian, Mingguan, Bulanan) langsung pada grafik mereka. Level-level ini sering berfungsi sebagai area penting support dan resistance, zona inisiasi tren potensial, dan titik referensi penting dalam analisis pasar.
Warna garis, ketebalan, dan gaya sepenuhnya dapat disesuaikan, memberi Anda fleksibilitas untuk menyesuaikan tampilan dengan gaya trading pribadi Anda.
این اندیکاتور طراحی شده تا نقاط باز شدن کندلهای تایمفریمهای بالاتر را بسته به تایمفریم فعلی شما به هم متصل کند:
- اگر تایمفریم کمتر از یک ساعت باشد → باز شدن کندلهای روزانه را به هم وصل میکند.
- اگر تایمفریم چهارساعته باشد → باز شدن کندلهای هفتگی را به هم وصل میکند.
- اگر تایمفریم بزرگتر از چهارساعته و کوچکتر از هفتگی باشد → باز شدن کندلهای ماهانه را به هم وصل میکند.
این ویژگی به معاملهگر کمک میکند تا به سادگی سطوح مهم شروع دورههای بزرگتر (روزانه، هفتگی، ماهانه) را روی نمودار مشاهده کند. این سطوح اغلب بهعنوان نقاط کلیدی حمایت و مقاومت، شروع روندهای جدید یا محدودههای معاملاتی مهم در نظر گرفته میشوند.
با تنظیم رنگ، ضخامت و نوع خط، میتوانید نمایش این خطوط را مطابق با سبک معاملاتی خود شخصیسازی کنید.


