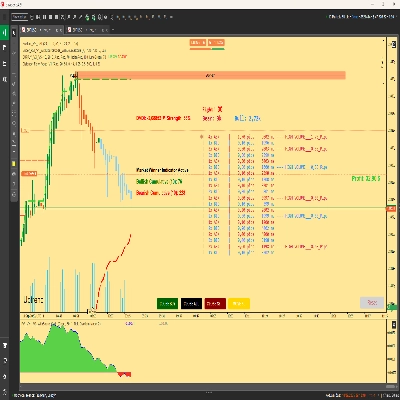
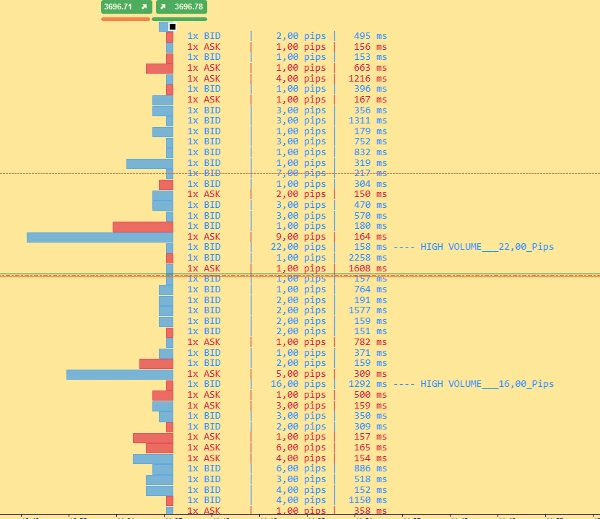
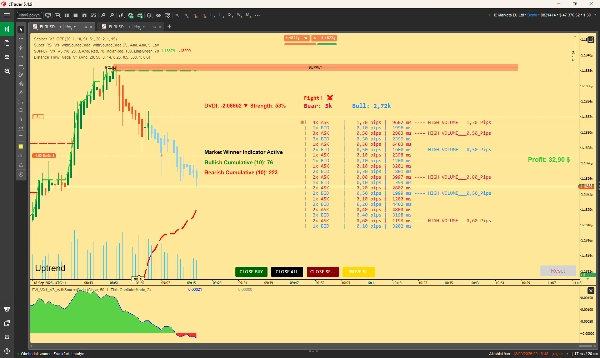
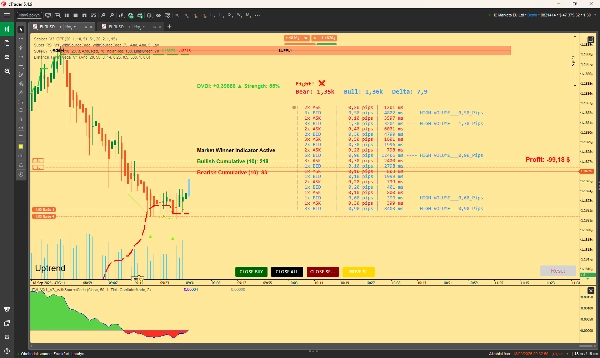
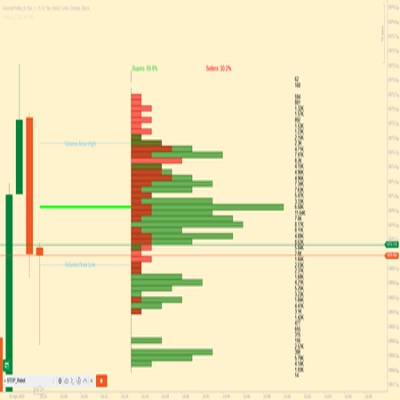
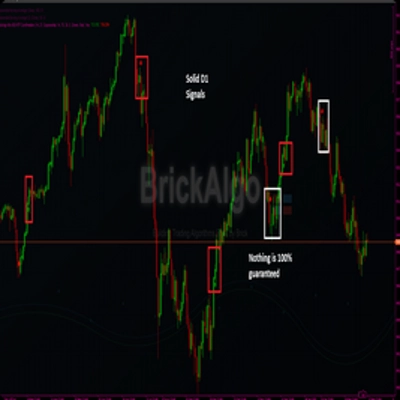
Logo de "ORDERFLOW_SKIA_Plynuly"
ORDERFLOW_SKIA_Plynuly
Image mise en ligne de "ORDERFLOW_SKIA_Plynuly"
Depuis le 09/01/2025
10.14K
Installations gratuites

This Indicator will show you Direction, Distance, and Time; Use this indicator exactly at support and resistance zones to see who the winner is. You will see many high volume texts , while there is bid high volume and bear high volume, do not enter, wait until it calms down and watch where the price is going , the winner is a Bear or Bull? You will see :-) . This indicator will not give you pure buy sell signals, it will give you much more, give to it a time , watch what is happening on chart and watch my indicator and you will soon realize they way to earn some cash is not that hard. Have a nice day. If this Indicator proves useful , i have also much better and polished version with much more signals, and informations. Latest version + Source = $5000 Usd

Profil de l'indicateur
0.0
Avis : 0
Avis clients
Il n'y a pas encore d'avis sur ce produit. Vous l'avez déjà essayé ? Soyez le premier à en parler aux autres !
BTCUSD
Forex
Signal
Breakout
Indices
EURUSD
Commodities
GBPUSD
NZDUSD
Prop
Scalping
Crypto
Stocks
XAUUSD
NAS100
USDJPY
Les produits disponibles sur cTrader Store, notamment les bots de trading, les indicateurs et les plug-ins, sont fournis par des développeurs tiers et mis à disposition à titre informatif et à des fins d'accès technique uniquement. cTrader Store n'est pas un courtier et ne fournit aucun conseil en investissement, aucune recommandation personnelle ni aucune garantie quant aux performances futures.

Plus de cet auteur

Cumulative delta candles + volume profile
Support and Resistance.
Scalpers Volume Profile
Volume Profile Supply Demand
Supply and Demand Zones
Robust Cumulative delta,Atr and imbalance indicator.
TAPE READER :-)
Break Out Probability Experimental indicator. Credits for this indicator goes to Zeiierman !!!
Demo of my main indcator.
Multi Timeframe Candle drawing. Draw Any candles from any timeframe on your chart :-)

Vous pourriez aussi aimer

Automatically detects and marks higher highs, lower highs, lower lows and higher lows.Check the other version in my page
Opening Price Rays for cTrader
Traders Panel: Scan 15 pairs across 5 timeframes. Live heatmap, strength rankings and best setups in one panel.
The QQE (Quantitative Qualitative Estimation) Weighted Oscillator improves its original version by weighting the RSI.
Advanced RSI: Enhanced algorithm, signal line, smart colors, shaded zones, 4 MA types - Superior accuracy for pro tradin
Lightweight Risk-Reward Visualization Tool.
Order BlockIndicator reversal
Identifies trends with moving averages & volatility. Base levels = bullish 🐂 or bearish 🐻 signals. Reversals detected!
Plot higher-timeframe Bollinger Bands for clearer structure, pullback zones, and breakout signals—without switching char
WICK COMMANDER — Know Exactly When the Market Commits
A precision tool for measuring how efficiently price moves from point A to B.
Customize your Moving Average! Choose any timeframe and price source for precision and flexibility in your analysis.
Logo de "Order Block Finder"
5.0
(2)
Gratuit
Order Block Detector is built to spot and display Order Blocks on chart, often triggering strong price reactions.
Unlike most indicators that show signals blindly, this show valid entries inside TREND ZONES and visual trend BACKTESTS.
Auto-marks key Highs/Lows. Spot swing points & market structure instantly. Fully customizable for any timeframe.
This indicator is perfect for traders looking to focus on high-probability trading windows.
Stop Loss Pro – Precision Risk Management for Every Trader
Plot ATR-based SL and 1R/2R/3R TPs instantly for any trade, with clear R-multiple risk mapping.
Depuis le 09/01/2025
10.14K
Installations gratuites