

WeTrades Liquidity Swings
อินดิเคเตอร์
298 ดาวน์โหลด
เวอร์ชัน 1.0, Apr 2026
Windows, Mac

4.03K
ติดตั้งฟรี
คำอธิบาย
ความผันผวนของสภาพคล่อง
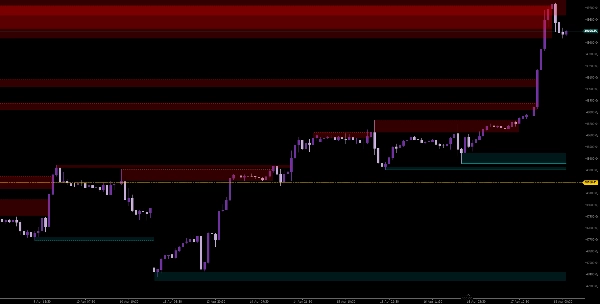
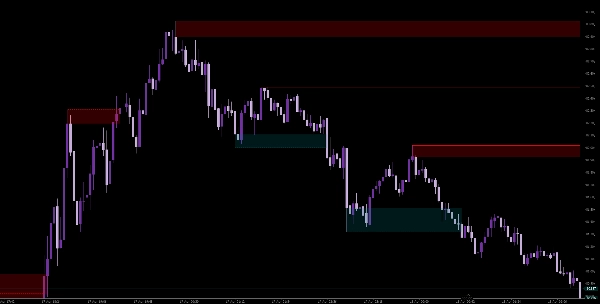
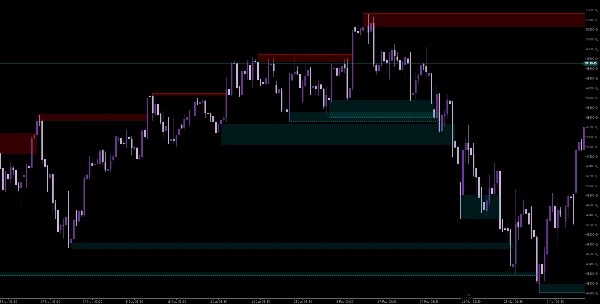
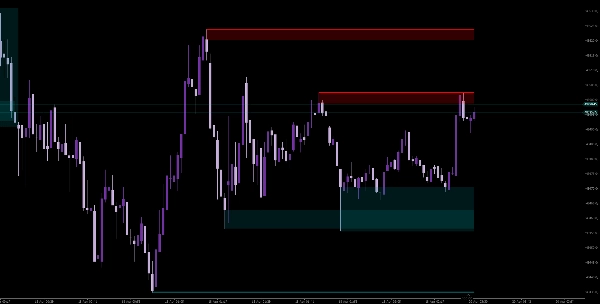
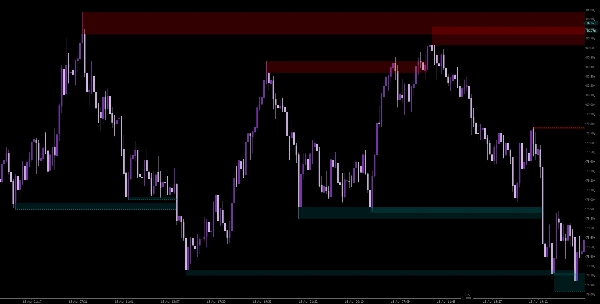
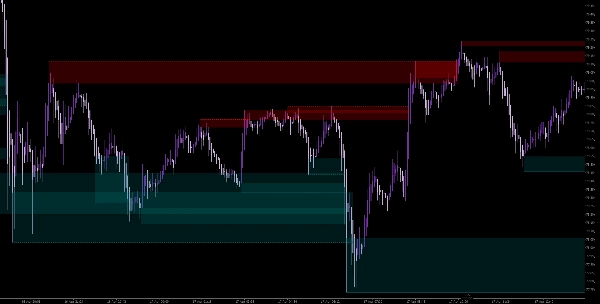
ความผันผวนของสภาพคล่อง เป็นเครื่องมือที่แม่นยำออกแบบมาเพื่อระบุและแสดงภาพโซนสภาพคล่องสำคัญที่เกิดขึ้นรอบจุดสูงสุดและต่ำสุดของสวิง สร้างขึ้นสำหรับเทรดเดอร์ที่เน้นโครงสร้างตลาด ตัวบ่งชี้นี้เน้นพื้นที่ที่ราคามีแนวโน้มที่จะตอบสนอง พลิกกลับ หรือทะลุด้วยแรงโมเมนตัม
คุณสมบัติหลัก
- การตรวจจับสวิงอัตโนมัติ
ระบุจุดสูงสุดและต่ำสุดของพิวอตโดยใช้ช่วงเวลาย้อนหลังที่ตั้งค่าได้ - การแสดงภาพโซนสภาพคล่อง
แสดงโซนตาม: -
- ปลายไส้เทียน (จุดเข้าที่แม่นยำ)
- ช่วงเทียนเต็มรูปแบบ (พื้นที่สภาพคล่องกว้างขึ้น)
- การติดตามจำนวนการสัมผัส
นับจำนวนครั้งที่ราคามีปฏิสัมพันธ์กับแต่ละโซน ช่วยให้คุณประเมินความแข็งแกร่งและความสำคัญ - การยืนยันการทะลุ
ทำเครื่องหมายอย่างชัดเจนเมื่อระดับสภาพคล่องถูกทะลุด้วยการปิดที่ยืนยันเกินระดับนั้น - วัตถุแผนภูมิแบบไดนามิก
โซนและระดับขยายแบบเรียลไทม์และอัปเดตเฉพาะบนเทียนที่ยืนยันเพื่อความแม่นยำ - รูปลักษณ์ที่ปรับแต่งได้
-
- สีแยกสำหรับจุดสูงสุดและต่ำสุด
- ความทึบของโซนที่ปรับได้
- ตัวเลือกแสดงจุดสูงสุด/ต่ำสุดของสวิง
- เพิ่มประสิทธิภาพการทำงาน
จัดการวัตถุแผนภูมิอย่างมีประสิทธิภาพด้วยขีดจำกัดที่ตั้งค่าได้สำหรับระดับที่เก็บไว้
ช่วยให้คุณเทรดได้อย่างไร
- ระบุ พูลสภาพคล่อง ที่มีแนวโน้มว่าจะมีจุดหยุดพัก
- สังเกต โซนปฏิเสธ สำหรับการกลับตัวที่เป็นไปได้
- ยืนยัน การทะลุ ด้วยการตรวจสอบโครงสร้าง
- ปรับปรุง ความแม่นยำในการเข้า โดยใช้การสัมผัสซ้ำ
กรณีการใช้งานที่ดีที่สุด
- แนวคิดเงินอัจฉริยะ (SMC)
- กลยุทธ์การเทรดที่อิงกับสภาพคล่อง
- การปรับปรุงแนวรับและแนวต้าน
- การตั้งค่าการทะลุและทดสอบใหม่
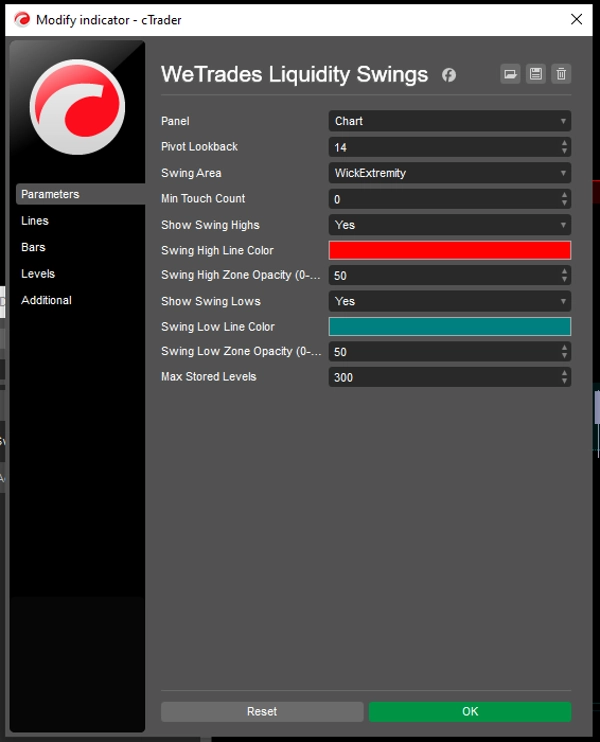
พารามิเตอร์
- ช่วงเวลาย้อนกลับของพิวอต – กำหนดความไวของสวิง
- โหมดพื้นที่สวิง – ไส้เทียนหรือช่วงเต็ม
- จำนวนการสัมผัสขั้นต่ำ – กรองระดับที่อ่อนแอ
- จำนวนระดับที่เก็บไว้สูงสุด – ควบคุมความรกของแผนภูมิ
สรุป
สรุปโดย AI
WeTrades Liquidity Swings is a technical indicator designed to identify and visualize key liquidity zones around swing highs and lows on price charts. It automatically detects pivot points using a configurable lookback period and highlights liquidity zones based on either wick extremities for precise entries or full candle ranges for broader areas. The indicator tracks how many times price touches each zone, aiding in assessing their strength, and confirms breaks by marking when price closes beyond a liquidity level. Zones dynamically extend in real time and update only on confirmed candles to maintain accuracy. Users can customize the appearance with separate colors for highs and lows, adjustable opacity, and optional swing point display. The tool is optimized for performance with limits on stored levels to reduce chart clutter. It supports trading approaches focused on Smart Money Concepts, liquidity-based strategies, refined support and resistance, and breakout/retest setups. Parameters include pivot lookback sensitivity, swing area mode, minimum touch count filter, and maximum stored levels. This indicator provides visual structure clarity to help traders identify liquidity pools, rejection zones, confirm breakouts, and improve entry precision.
โปรไฟล์อินดิเคเตอร์
หมวดหมู่อินดิเคเตอร์
แนวรับและแนวต้าน
ประเภทเอาต์พุต
การแสดงเป็นภาพ
ข้อกำหนดด้านข้อมูล
แท่งเท่านั้น
สัญญาณที่รองรับ
Breakout
Reversal
แตะ Level ที่ระบุ
เบรก Level ที่ระบุ
Range ณ เวลาที่เปิดเซสชัน
การสนทนา
รีวิวจากลูกค้า
0.0
รีวิว: 0
รีวิวจากลูกค้า
ยังไม่มีรีวิวสำหรับผลิตภัณฑ์นี้ หากเคยลองแล้ว ขอเชิญมาเป็นคนแรกที่บอกคนอื่น!
คำถามที่พบบ่อย
Key Levels
MSS
Market Structure
Support & Resistance
ผลิตภัณฑ์ที่มีให้บริการผ่าน cTrader Store รวมถึงบอทการเทรด อินดิเคเตอร์ และปลั๊กอิน มีให้บริการโดยนักพัฒนาบุคคลที่สามและมีไว้เพื่อวัตถุประสงค์ในการเข้าถึงข้อมูลและทางเทคนิคเท่านั้น cTrader Store ไม่ใช่โบรกเกอร์และไม่ได้ให้คำแนะนำการลงทุน คำแนะนำส่วนบุคคล หรือการรับประกันผลการดำเนินงานในอนาคต
เพิ่มเติมจากผู้เขียนคนนี้


















!["[Hamster-Coder] Pivot Points MTF" โลโก้](https://cdn.ctrader.com/image/webp/4c143e5a-309c-40e3-a578-f04d1e133ffa_31159)









ราคา
4.03K
ติดตั้งฟรี