
Description
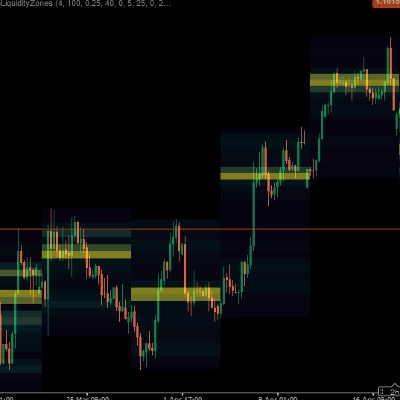
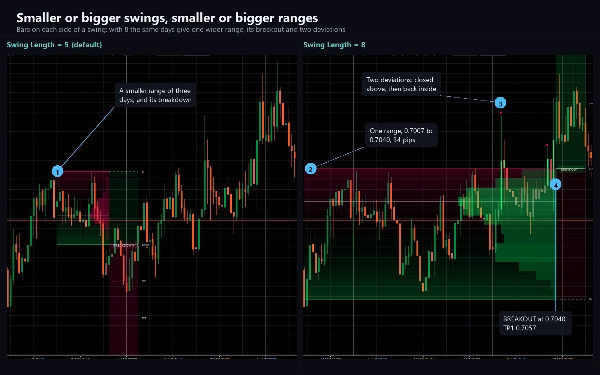
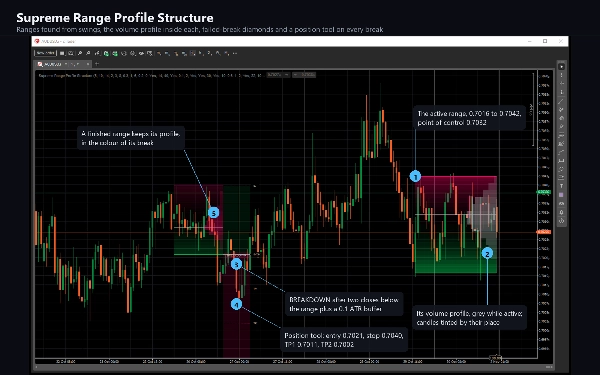
Supreme Range Profile Structure finds sideways ranges from the market's own swings, shows where the volume
traded inside each one, marks the moves that left the range and failed, and draws a position tool when a range
finally breaks. A range is drawn only when recent swing highs and lows cluster tightly, alternate often
enough, span enough bars and fit an ATR width window, so it marks a real balance rather than any pause.
WHAT IT DRAWS
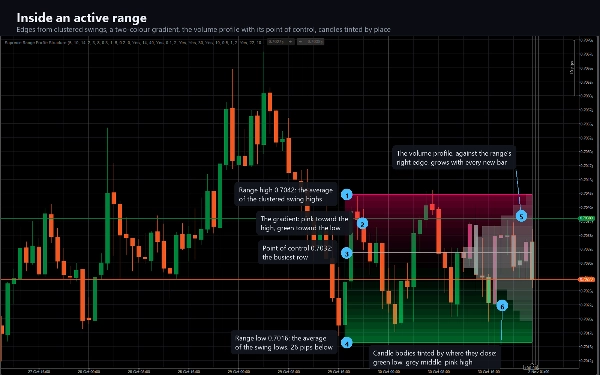
- Each range as a band shaded in two colours, bearish above and bullish below, fading into each other in
the middle, with a line along each edge. An edge line gets stronger with every swing that touches it.
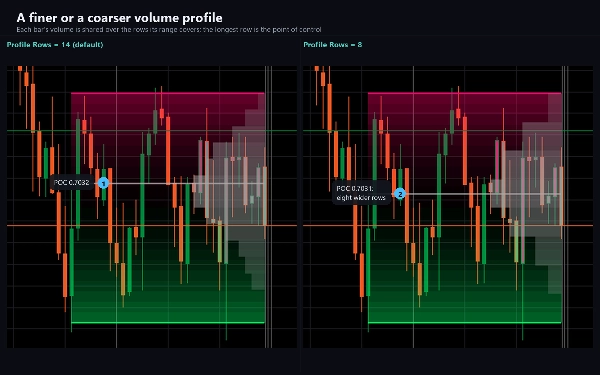
- A volume profile inside the range: up to 16 horizontal rows against its right edge, each as long as the
volume traded at its prices, with a point-of-control line at the busiest row.
- Diamonds at the extreme of every move that closed outside the range and then closed back inside it:
above the range when price came back from above, below it when it came back from below.
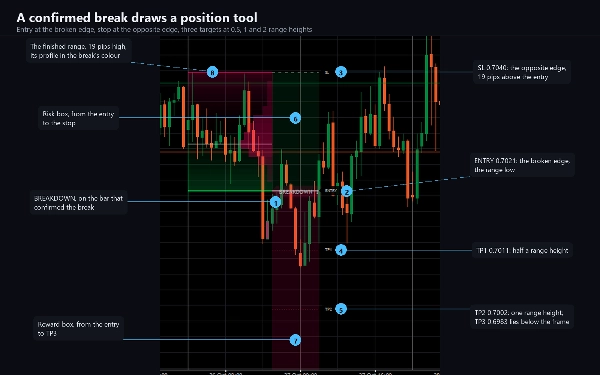
- The BREAKOUT or BREAKDOWN tag on the bar that confirmed a break.
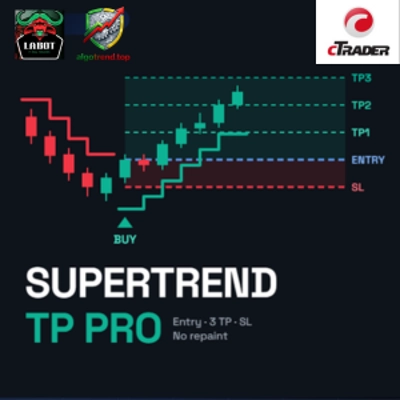
- A position tool on every break: entry at the broken edge, stop at the opposite edge, three targets at
multiples of the range height, a reward box and a risk box, and ENTRY, SL, TP1, TP2 and TP3 tags.
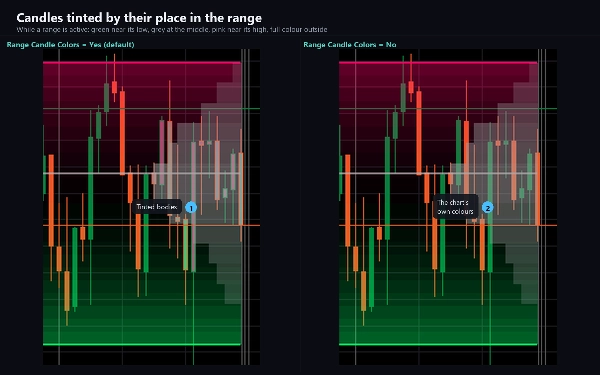
- Candles coloured by where they close inside the active range: bullish near its low, bearish near its
high, and in full colour once they close outside.
- An optional dotted equilibrium line at the middle of each range.
- The last ten finished ranges stay on the chart with their profile, tag and position tool.
HOW IT DECIDES
Swings are pivots with five bars on each side by default. The newest ten alternating swings are searched
for the largest group whose highs spread no more than 0.6 ATR, whose lows do the same, with at least two
touches on each edge, three rotations between them, covering at least eight bars, and a height between one
and six ATR. The averages of those highs and lows become the range edges. While the range is active, a new
swing that comes close to an edge moves that edge a fifth of the way toward it and counts as a touch, and
the profile grows with every new bar.
A close more than 0.1 ATR beyond an edge counts as outside, and two such closes in a row confirm a breakout
or a breakdown. A move that closed outside and then closed back inside is a deviation, marked at its
extreme. A range can be retired after a maximum number of bars too, without a break. After a range is
resolved, the indicator waits four bars before it looks for the next one.
Breaks, deviations and retirements are decided when a bar closes and never change afterwards. A range can
be found, and its edges and profile can move, while a bar is still forming; what that bar shows is final
when it closes.
KEY SETTINGS
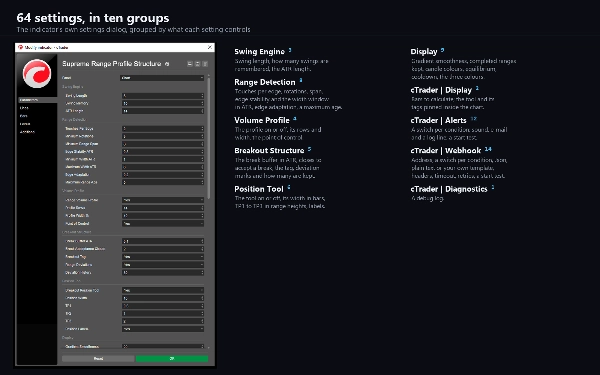
64 settings in ten groups: the swing engine, range detection, the volume profile, the breakout rules, the
position tool and the display, then groups for this platform: display, alerts, the webhook and
diagnostics. One setting decides how much history the ranges are found in (20,000 bars by default).
ALERTS AND WEBHOOK
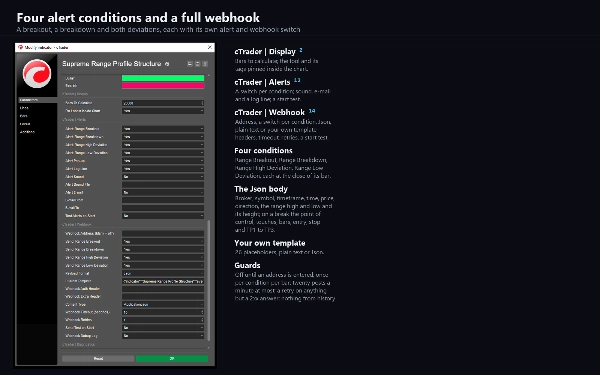
Four conditions, each with its own switch: a breakout, a breakdown, a high deviation and a low deviation.
Each can arrive as a log line, a sound of your choice and e-mail, at the close of the bar that made it, and
a test on start checks your settings without waiting for an event. Nothing fires while the indicator walks
the chart's history, and nothing fires in a backtest.
A webhook posts the same four conditions, each with its own switch, to any address you enter: a chat bot,
a journal, an automation flow or your own server. Choose a JSON body with the bar, the direction, the range
high and low and its height, and on a break the point of control, the touches, the entry, the stop and the
three targets; the plain alert sentence; or your own template with 26 placeholders. Add an access key
header and one more header of your own. A post that gets no success answer is sent again, and a test on
start checks the address. It stays off until you enter one, is sent once per condition per bar, is capped
at twenty messages a minute, and a failure is logged rather than thrown. It sends through cTrader's own
networking service, which is why the indicator needs no file or network access rights at all.
TYPE AND WINDOW
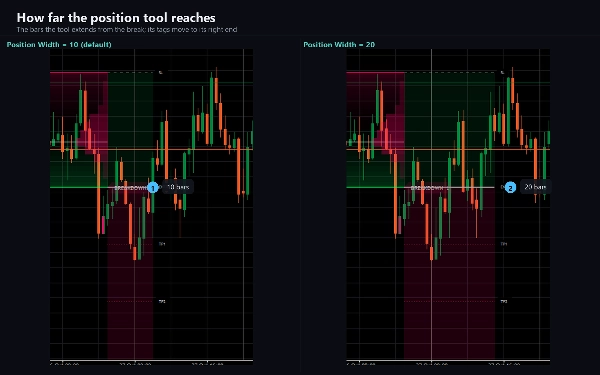
An overlay indicator: everything is drawn on the price chart, and it adds no separate pane. A fresh
position tool reaches ten bars past its break, and cTrader leaves little room after the last bar. By
default the tool and its tags are kept inside the chart while the last bar is in view; one switch places
them at their exact bars.
TIMEFRAMES AND INSTRUMENTS
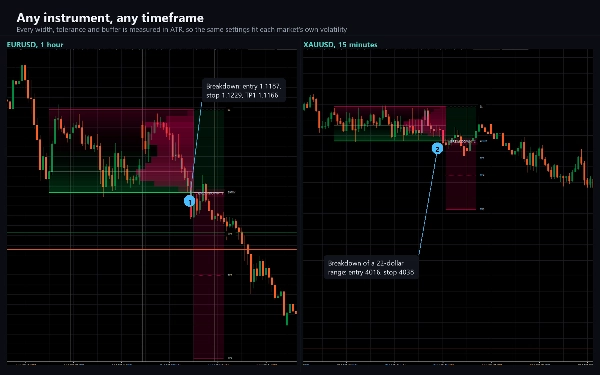
Any timeframe from one minute to daily and any instrument: forex pairs, metals, indices and crypto. Every
width, tolerance and buffer is measured in ATR, so the same settings fit each market's own volatility. When
it attaches, the indicator loads the history it needs, up to the history setting.
USE CASES
- Seeing where the market is balanced, and where inside the balance the volume traded.
- Waiting for a range to break with acceptance, closes beyond the edge plus a buffer, instead of reacting
to the first poke outside.
- Spotting failed breaks: the deviation marks show where price left the range and came back.
- Planning a breakout from a tool built on the range: entry, stop and three targets measured in range
heights.
- Being told by log line, sound, e-mail or webhook when a range breaks or a deviation is confirmed.
WHO IT IS FOR
Traders who work with ranges, balance and breakouts, and want them found by fixed rules, with the volume
inside them in view, rather than drawn by hand.
TECHNICAL NOTES AND LIMITATIONS
Access rights: none. The indicator cannot read files, start processes or open connections of its own.
It is a charting and analysis tool. It does not place orders and it has no access to your account. The
position tool's levels are measured from the range; they are reference levels, not a forecast.
The profile and its point of control use your broker's tick volume, and the swings use your broker's
candles, so another feed can draw different ranges. The ranges are found over the bars in the history
setting, so a different depth there can change which ranges come first.
SUPPORT
Questions go through the Discussion tab. Include your broker, symbol, timeframe, cTrader version and
a screenshot of the full chart, and you will get a useful answer first time.
Trading involves risk. Past performance does not guarantee future results.