
VolumeColorBar
Indikator
10 pembelian
Versi 1.2, Apr 2026
Windows, Mac
4.3
Ulasan: 3
Deskripsi
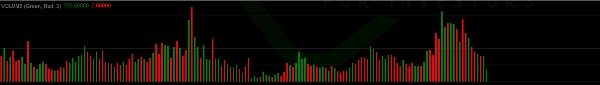
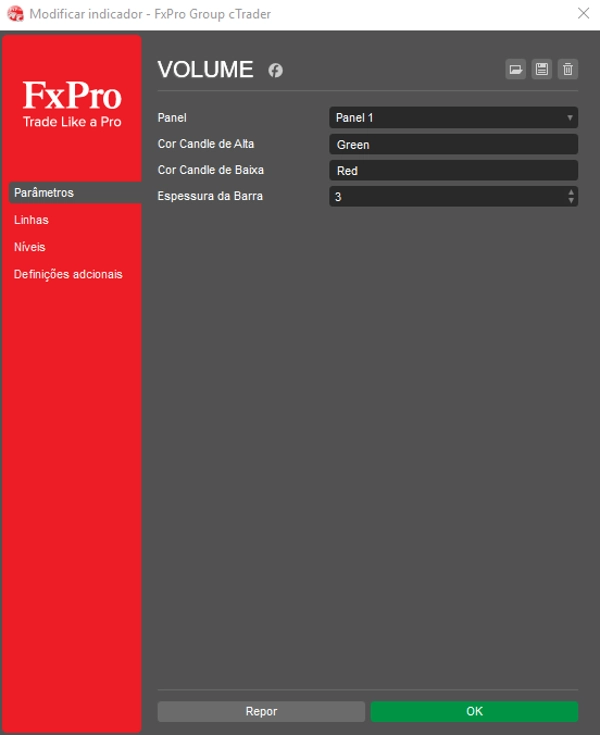
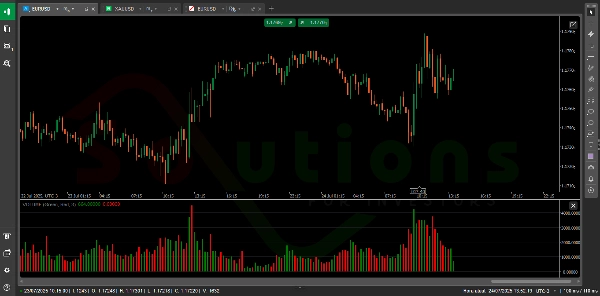
VolumeColorBar adalah alat yang kuat yang secara visual merepresentasikan volume pasar menggunakan batang berwarna berdasarkan arah candle. Batang hijau menunjukkan volume pada candle bullish (tekanan beli), sementara batang merah mencerminkan volume pada candle bearish (tekanan jual). Ini memungkinkan trader untuk langsung menilai apakah aktivitas pasar lebih didorong oleh pembeli atau penjual — membantu mengonfirmasi breakout, mengidentifikasi pembalikan, dan meningkatkan waktu perdagangan dengan kepercayaan lebih besar.
Ringkasan
Ringkasan AI
VolumeColorBar is a trading indicator that visualizes market volume using color-coded bars aligned with candle direction. It displays green bars for volume on bullish candles, indicating buying pressure, and red bars for volume on bearish candles, indicating selling pressure. This visual representation helps traders quickly assess whether market activity is dominated by buyers or sellers. The indicator supports various markets and symbols, including Forex pairs (EURUSD, GBPUSD, NZDUSD, USDJPY), cryptocurrencies (BTCUSD, crypto), commodities (XAUUSD, gold, oil, silver), indices (NAS100, SP500, DAX, Dow), and stocks. By providing immediate insight into volume dynamics relative to price movement, VolumeColorBar aids in confirming breakouts, identifying potential reversals, and improving trade timing decisions.
Profil indikator
Ulasan pelanggan
4.3
Ulasan: 3
5 | 33 % | |
4 | 67 % | |
3 | 0 % | |
2 | 0 % | |
1 | 0 % |
Ulasan pelanggan
April 14, 2025
Clean tool for workflow for a more controlled workflow. It helps with planning entries around the first range, but false breaks still need filtering. I would track 20 market opens, the first 30 to 60 minutes and a target near 1.5R. I would still keep manual review in the process.
April 13, 2025
April 13, 2025
Worth a closer look around opening range breakouts. The useful part is planning entries around the first range, with the numbers checked before scaling. The setup should be tested across at least 15 sessions because 2 or 3 fakeouts can change the picture. The trade idea is clear, but it needs a hard stop and a defined breakout rule.
Diskusi
Pertanyaan umum
BTCUSD
Forex
Signal
Breakout
Indices
EURUSD
Commodities
GBPUSD
NZDUSD
Prop
Crypto
Stocks
XAUUSD
NAS100
USDJPY
Produk-produk yang tersedia melalui cTrader Store, termasuk bot trading, indikator, dan plugin, disediakan oleh pengembang pihak ketiga serta hanya ditujukan untuk akses teknis dan informasi. cTrader Store bukan broker dan tidak menyediakan saran investasi, rekomendasi pribadi, atau jaminan apa pun tentang kinerja di masa mendatang.


Harga
Sejak 05/02/2025
31
Penjualan