
Deskripsi
Custom RSI – Pembalikan Spot dengan Presisi dan Visual yang Bersih
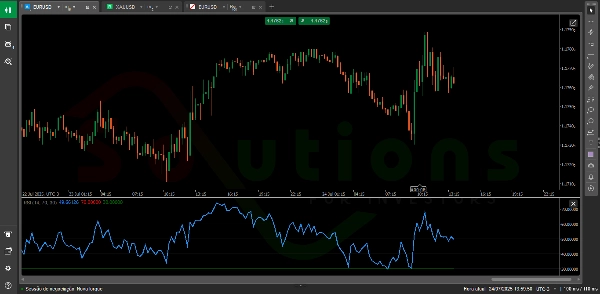
Custom RSI adalah versi yang ditingkatkan dari Relative Strength Index (RSI) klasik, dirancang untuk membantu trader dengan cepat mengidentifikasi zona jenuh beli dan jenuh jual—area kunci di mana harga kemungkinan akan berbalik.
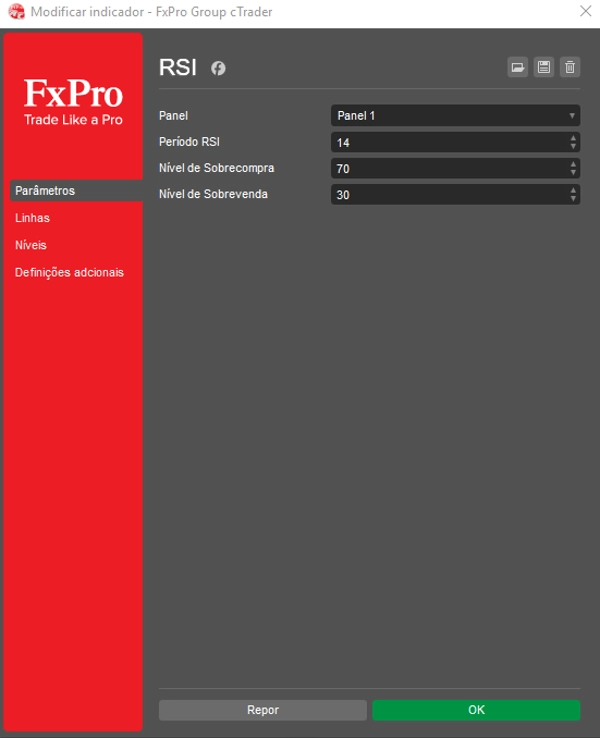
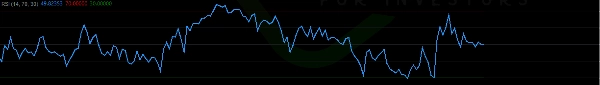
Dengan antarmuka yang bersih dan intuitif, ini menampilkan dua garis horizontal yang sepenuhnya dapat disesuaikan (seperti level tradisional 70 dan 30), dengan jelas menandai titik keputusan dengan probabilitas tinggi pada grafik.
✅ Sesuaikan kerangka waktu dan level RSI agar sesuai dengan gaya trading Anda
✅ Identifikasi zona pembalikan potensial dengan kepercayaan lebih besar
✅ Tingkatkan analisis teknikal Anda dengan indikator yang jelas dan tanpa kekacauan
Sempurna untuk trader dari semua level, Custom RSI mengubah data harga mentah menjadi wawasan cerdas dan dapat ditindaklanjuti—menjadikannya alat penting untuk pengambilan keputusan yang menguntungkan.
Ringkasan
Ulasan pelanggan
5 | 0 % | |
4 | 100 % | |
3 | 0 % | |
2 | 0 % | |
1 | 0 % |


