
Mô tả
Mở khóa Giao dịch Chính xác với Công nghệ Theo dõi Xu hướng Cách mạng của Chúng tôi
BrickAlgo TrendTracker là chỉ báo nhận diện xu hướng tối ưu được thiết kế đặc biệt cho cTrader. Công cụ kỹ thuật mạnh mẽ này giúp bạn dễ dàng phát hiện các điểm đảo chiều thị trường quan trọng, cung cấp tín hiệu trực quan rõ ràng cho các điểm vào và thoát lệnh tối ưu.
Các Tính Năng Chính:
- Phát Hiện Xu Hướng Động: Nhận diện sự thay đổi xu hướng dựa trên phân tích hành động giá
- Hệ Thống Tín Hiệu Trực Quan: Mũi tên mã màu hiển thị sự chuyển đổi xu hướng tăng và giảm
- Theo Dõi Hiệu Suất: Hiển thị giá trị pip tùy chọn cho biết lợi nhuận/thua lỗ giữa các tín hiệu
- Cài Đặt Tùy Chỉnh: Điều chỉnh tham số phù hợp với phong cách giao dịch và khung thời gian của bạn
- Giao Diện Biểu Đồ Sạch: Thiết kế phủ giúp biểu đồ của bạn không bị rối mắt
Cách Hoạt Động:
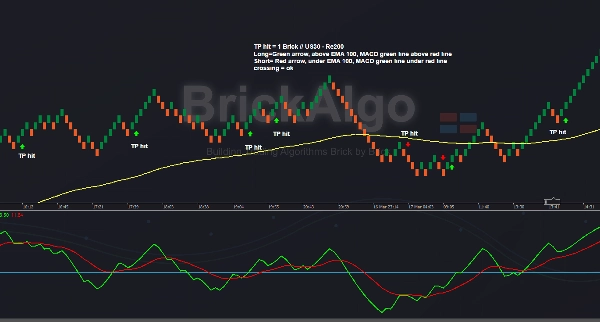
BrickAlgo TrendTracker phân tích biến động giá bằng cách so sánh các giá trị hiện tại với trung bình làm mượt của giá cao và thấp. Khi phát hiện sự thay đổi mẫu đáng kể, chỉ báo sẽ tạo ra tín hiệu, giúp bạn nhận diện các điểm đảo chiều xu hướng tiềm năng trước khi chúng trở nên rõ ràng với các nhà giao dịch khác.
Dưới đây là giải thích ngắn gọn về cách sử dụng chỉ báo:
- Tải Chỉ Báo: Thêm chỉ báo vào biểu đồ của bạn từ menu chỉ báo trong cTrader.
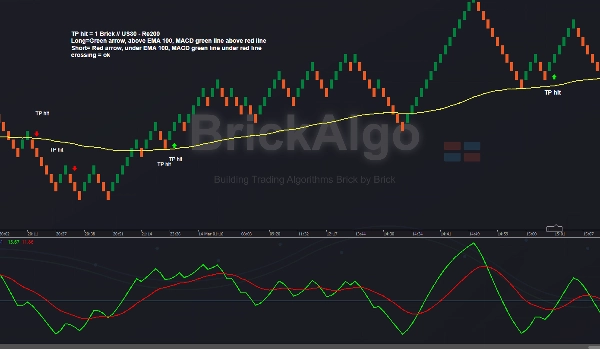
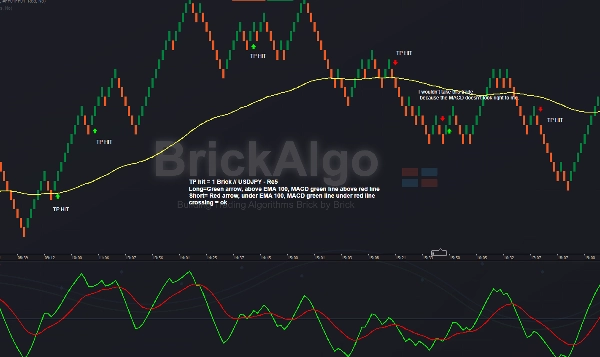
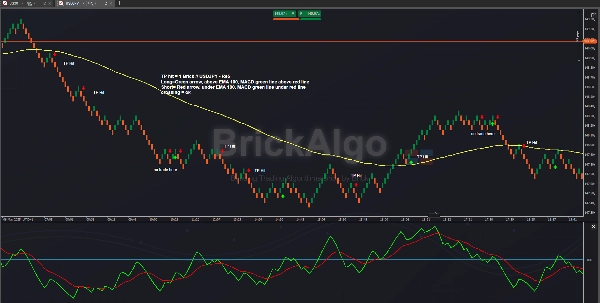
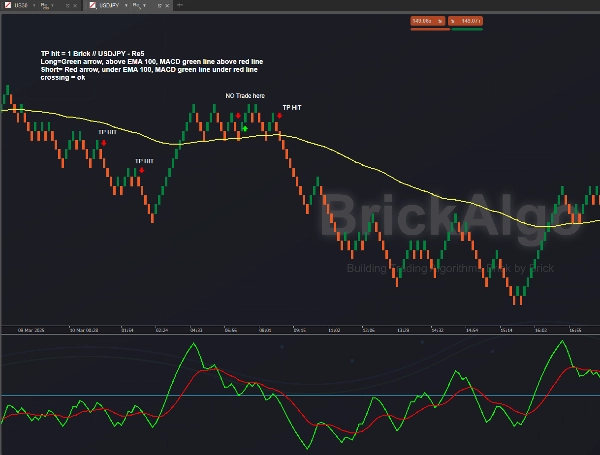
- Sử Dụng Biểu Đồ Renko (ví dụ, Re5): Đảm bảo bạn đang sử dụng biểu đồ Renko, chẳng hạn như Re5, chỉ là một ví dụ. Chỉ báo hoạt động với các kích thước viên gạch khác nhau. Cá nhân tôi giao dịch USDJPY trên Re5 và US30 trên Re100 và Re200 với chỉ báo này.
- Điều Chỉnh Cài Đặt: Tham khảo các ảnh chụp màn hình được cung cấp để biết cài đặt chỉ báo được khuyến nghị.
- Lọc Tín Hiệu: Để xác nhận giao dịch tốt hơn, sử dụng MACD như trong các ảnh chụp màn hình, xác nhận HTF, Hỗ trợ & Kháng cự, EMA hoặc các chỉ báo BrickAlgo khác như BrickAlgo TrendPulse.
- TP & SL: Tôi sử dụng 1 kích thước viên gạch cho Take Profit (TP), trong khi Stop Loss (SL) thay đổi, thường nằm trong khoảng 1 đến 3 viên gạch.
Cá nhân tôi thích giao dịch USDJPY trên biểu đồ Re5 và sử dụng 100 EMA và MACD, như trong các ảnh chụp màn hình. Tôi sử dụng BrickAlgo TrendPulse để thực hiện các giao dịch bổ sung.


![Logo "[CB] Pivot Points Pro"](https://cdn.ctrader.com/image/webp/43463c82-67b0-4f10-a4ba-901bba091d81_32594)

