
Sniper Zone Pro
Indikator
3 pembelian
Versi 1.0, Jan 2026
Windows, Mac
4.6
Ulasan: 3
Deskripsi
Indikator Sniper Zone Pro
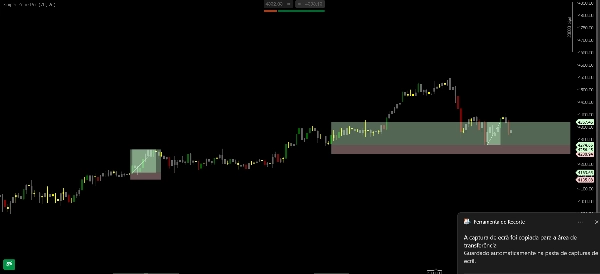
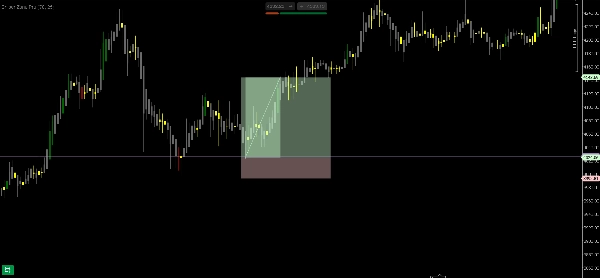
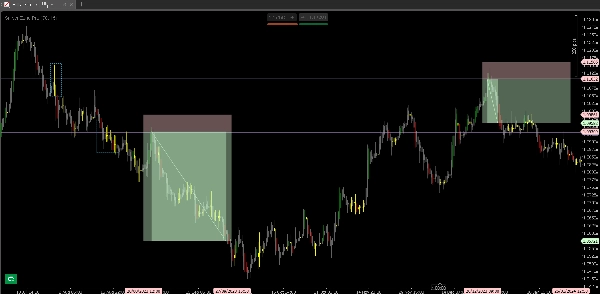
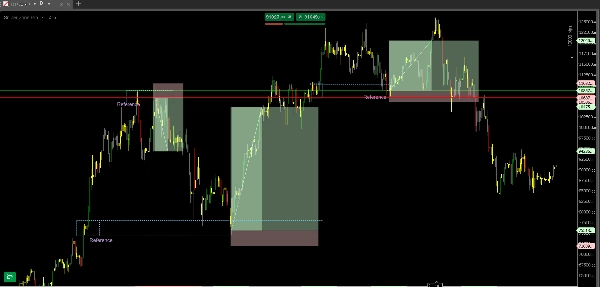
The Sniper Zone Pro adalah alat analisis canggih yang dirancang untuk mengidentifikasi jejak institusi besar secara visual pada grafik harga. Ini menggabungkan pemetaan zona ketidakpastian masa lalu dengan sistem pewarnaan lilin yang mengungkapkan gerakan manipulasi dan kekuatan institusional. Indikator ini mengubah kekacauan pasar menjadi wilayah operasional yang jelas, memungkinkan trader untuk mengidentifikasi dengan tepat di mana harga "berjuang" dan di mana cenderung diuji sebelum ekspansi baru.
Fitur Utama Sniper Zone Pro
- Pemetaan "Zona Pertempuran": Secara otomatis mengidentifikasi area ketidakpastian di mana harga mengakumulasi volume. Wilayah ini menjadi "zona operasi" yang krusial, karena mewakili level harga dengan perselisihan signifikan antara pembeli dan penjual.
- Pewarnaan Institusional Aktif: Sistem warna ini bukan hanya estetika; ini menyoroti lilin dengan karakteristik gerakan institusional (seperti volume tinggi atau absorpsi), memisahkan kebisingan pasar dari niat pemain besar.
- Zona Uji Probabilitas Tinggi: Saat mencapai wilayah kunci, indikator membantu memvisualisasikan apakah harga hanya menguji zona tersebut atau siap menembus, menawarkan pemicu masuk yang jauh lebih tepat.
- Filter Hirarki (HTF): Memprioritaskan zona minat pada kerangka waktu yang lebih tinggi, di mana pertempuran harga memiliki relevansi teknis yang lebih besar dan potensi pengembalian yang jauh lebih tinggi.
Mengapa Menggunakan Sniper Zone Pro?
- Membaca Niat Pasar: Dengan mengamati warna lilin dalam zona pertempuran, trader dapat mengidentifikasi apakah institusi mempertahankan posisi tersebut atau meninggalkannya.
- Menentukan Zona Operasi: Menghilangkan keraguan tentang "di mana harus berdagang." Indikator menunjukkan bahwa peluang terbaik tidak ditemukan di tengah pergerakan, melainkan pada pengujian wilayah di mana harga sebelumnya menunjukkan ketidakpastian.
- Pengurangan Subjektivitas: Trader berhenti mencoba "menebak" puncak dan dasar dan mulai beroperasi berdasarkan area minat profesional yang terbukti.
Ringkasan
Ringkasan AI
Sniper Zone Pro is an advanced trading indicator designed to visually identify institutional activity on price charts by mapping past indecision zones and applying a candle coloring system that highlights market manipulation and institutional strength. It automatically detects "battle zones" where price accumulated volume, marking key operational areas of buyer-seller disputes. The indicator’s color-coded candles reveal institutional movements such as high volume or absorption, helping traders distinguish significant market actions from noise. It also highlights high-probability test zones, indicating whether price is testing or ready to break through these critical levels. A hierarchy filter prioritizes zones from higher timeframes, emphasizing areas with greater technical relevance. Sniper Zone Pro supports multiple markets including Forex, cryptocurrencies, stocks, commodities, and indices, with tags referencing symbols like BTCUSD, EURUSD, GBPUSD, XAUUSD, NAS100, and USDJPY. The tool aids traders in reading market intent by showing institutional defense or abandonment of price levels, defining precise operating zones to reduce subjectivity, and focusing trading decisions on professional interest areas rather than arbitrary price points.
Profil indikator
Ulasan pelanggan
4.6
Ulasan: 3
5 | 67 % | |
4 | 33 % | |
3 | 0 % | |
2 | 0 % | |
1 | 0 % |
Ulasan pelanggan
January 19, 2026
The best part is random clicks become easier to catch, and a 1R exit plan makes review easier.
January 14, 2026
H1 makes the signal less noisy, and it adds a useful layer without forcing action.
January 5, 2026
No reason to yolo this live without a few normal sessions. The result needs a journal.
Diskusi
Pertanyaan umum
BTCUSD
Forex
Signal
Breakout
Indices
EURUSD
Commodities
GBPUSD
NZDUSD
Scalping
Crypto
Stocks
XAUUSD
NAS100
USDJPY
Produk-produk yang tersedia melalui cTrader Store, termasuk bot trading, indikator, dan plugin, disediakan oleh pengembang pihak ketiga serta hanya ditujukan untuk akses teknis dan informasi. cTrader Store bukan broker dan tidak menyediakan saran investasi, rekomendasi pribadi, atau jaminan apa pun tentang kinerja di masa mendatang.

![Logo "[Stellar Strategies] Market Session Ultimate"](https://cdn.ctrader.com/image/webp/61ffd537-0125-4246-9e72-42eca1791d64_28232)


Harga
Sejak 11/07/2025
3
Penjualan