
Descripción
Supertrend Channels es un indicador personalizado de superposición diseñado para ayudar a los traders a identificar visualmente zonas dinámicas de soporte y resistencia, señales de entrada y niveles de stop-loss dinámicos utilizando lógica basada en ATR.
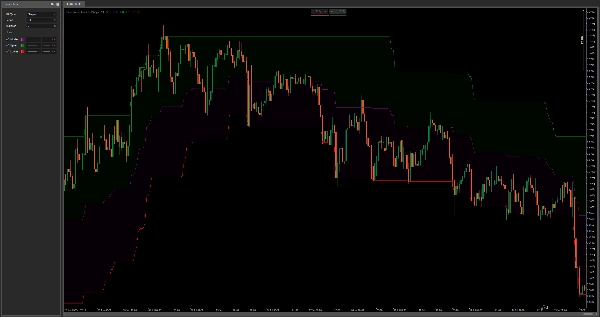
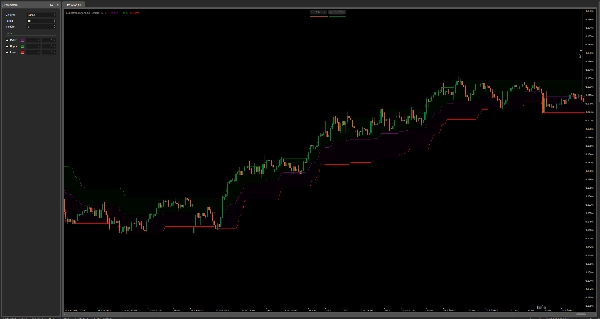
El indicador traza tres líneas:
- Banda Superior (Verde) – actúa como una resistencia dinámica o stop-loss dinámico para operaciones largas.
- Banda Inferior (Roja) – actúa como soporte dinámico o stop-loss dinámico para operaciones cortas.
- Línea Media (Púrpura) – sirve como nivel de reversión a la media o punto potencial de entrada.
Calcula las bandas usando el Average True Range (ATR) multiplicado por un factor definido por el usuario (Multiplier) y suma/resta eso al máximo/mínimo de la vela actual. Se aplica un método de suavizado (tipo de MA seleccionable) al ATR para ajustar la capacidad de respuesta.
Cómo usar:
- Entrada: Busca entradas cerca de la línea media durante consolidaciones o después de señales de cruce.
- Stop-Loss Dinámico: Usa bandas superior/inferior como zonas dinámicas de salida para asegurar ganancias a medida que las tendencias se extienden.
- Soporte y Resistencia: Estas bandas actúan como zonas adaptativas que reflejan la volatilidad reciente y ayudan a detectar posibles puntos de giro.
A diferencia de las Bandas de Bollinger estándar, este enfoque ancla las bandas en extremos de precio más volatilidad, no en una media móvil, haciéndolo más sensible en entornos de tendencia y más adaptable para trading discrecional o algorítmico.
Resumen
Valoraciones de clientes
5 | 50 % | |
4 | 50 % | |
3 | 0 % | |
2 | 0 % | |
1 | 0 % |


