
Mô tả
RSI Tùy Chỉnh – Đảo Chiều Chính Xác và Hình Ảnh Sạch Sẽ
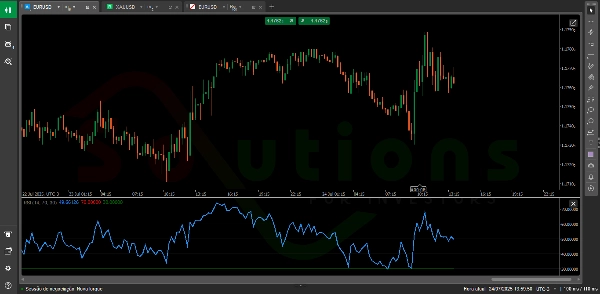
RSI Tùy Chỉnh là phiên bản nâng cao của Chỉ số Sức Mạnh Tương Đối (RSI) cổ điển, được thiết kế để giúp nhà giao dịch nhanh chóng xác định vùng quá mua và quá bán—những khu vực then chốt nơi giá có khả năng đảo chiều.
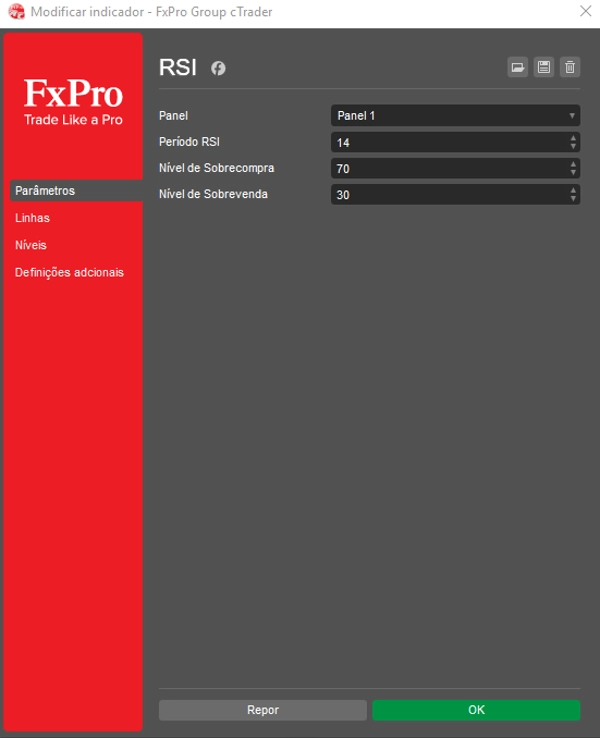
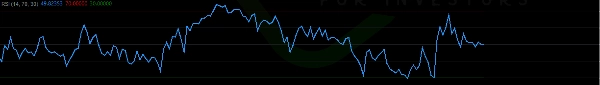
Với giao diện sạch sẽ và trực quan, nó hiển thị hai đường ngang hoàn toàn tùy chỉnh (như các mức truyền thống 70 và 30), đánh dấu rõ ràng các điểm quyết định có xác suất cao trên biểu đồ.
✅ Điều chỉnh khung thời gian và các mức RSI phù hợp với phong cách giao dịch của bạn
✅ Xác định các vùng đảo chiều tiềm năng với sự tự tin cao hơn
✅ Nâng cao phân tích kỹ thuật của bạn với một chỉ báo rõ ràng, không rối mắt
Phù hợp cho nhà giao dịch ở mọi cấp độ, RSI Tùy Chỉnh biến dữ liệu giá thô thành những hiểu biết thông minh, có thể hành động—biến nó thành công cụ thiết yếu cho việc ra quyết định có lợi nhuận.
Tóm tắt
Đánh giá của khách hàng
5 | 0 % | |
4 | 100 % | |
3 | 0 % | |
2 | 0 % | |
1 | 0 % |


