Mô tả
Chỉ báo Pinescriptlabs Store: Pinescriptlabs Store cBots : (cBot) Gold & BTC BreakoutSession Pivots(mới)
Thuật toán thông minh theo sau(Mới)
Hỗ trợ &
Kháng cự SmartTrend
Đường
Phân tích
Cấu trúc Thị trường
Động
của
Các điểm
Quay đầu
Hồi quy
Tuyến tính Fibonacci
Đa khung thời gian
Regression
Khe Giá Trị Công Bằng Động lực
Theo dõi
Định hướng Nến
Đa cấp
Tự động
Hỗ trợ và
Kháng cự
Xu hướng
Đường
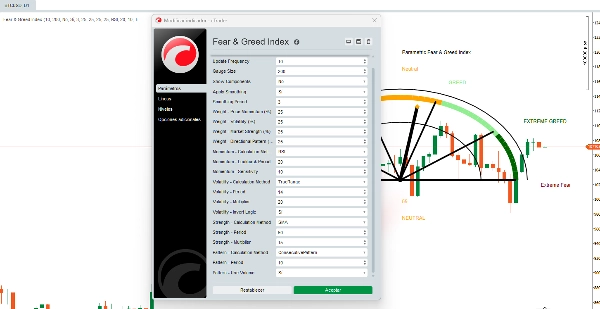
Chỉ số Sợ hãi & Tham lam
Chỉ báo Sợ hãi & Tham lam là một thuật toán trực quan tiên tiến tổng hợp tâm lý thị trường thành một giá trị 0-100 sử dụng một đồng hồ đo hình bán nguyệt. Khác với các phiên bản cơ bản, công cụ này hoàn toàn tùy chỉnh được, cho phép các nhà giao dịch điều chỉnh mọi khía cạnh của phép tính.
📊 4 Thành phần Cốt lõi (Có thể cấu hình)
1️⃣ Động lượng Giá *(Trọng số có thể cấu hình: 0-100%)*
6 Phương pháp Tính toán Có sẵn:
- PriceChange: Thay đổi % đơn giản so với kỳ trước
- ROC: Tỷ lệ thay đổi chuẩn hóa
- RSI: RSI sửa đổi cho động lượng
- SMADeviation: Độ lệch giá so với SMA
- EMADeviation: Độ lệch giá so với EMA
- MACD: Tín hiệu MACD như chỉ báo động lượng
🔧 Tham số Có thể Tùy chỉnh:
- Khoảng thời gian nhìn lại *(5-100)*
- Độ nhạy tính toán *(1.0-50.0)*
2️⃣ Biến động *(Trọng số có thể cấu hình: 0-100%)*
6 Phương pháp Tính toán Có sẵn:
- TrueRange: Biến động dựa trên True Range
- HighLowRange: Khoảng cách cao-thấp đơn giản
- CloseToClose: Biến động đóng cửa theo logarit
- ATR: Trung bình True Range tiêu chuẩn
- StandardDev: Độ lệch chuẩn giá
- ParkinsonVol: Bộ ước lượng biến động Parkinson
🔧 Tham số Có thể Tùy chỉnh:
- Khoảng thời gian tính toán *(5-50)*
- Hệ số nhân biến động *(1.0-100.0)*
- Đảo ngược logic (biến động cao hơn = sợ hãi hơn)
3️⃣ Sức mạnh Thị trường *(Trọng số có thể cấu hình: 0-100%)*
6 Phương pháp Tính toán Có sẵn:
- SMA: Vị trí so với Trung bình Động Đơn giản
- EMA: Vị trí so với Trung bình Động Lũy thừa
- VWAP: Vị trí so với Giá Trung bình Trọng số Khối lượng
- HLBand: Vị trí trong dải Cao-Thấp
- BollingerPos: Vị trí bên trong Dải Bollinger
- PivotDistance: Khoảng cách đến các điểm pivot
🔧 Tham số Có thể Tùy chỉnh:
- Khoảng thời gian tính toán *(10-200)*
- Hệ số nhân sức mạnh *(1.0-50.0)*
4️⃣ Mẫu Hướng *(Trọng số có thể cấu hình: 0-100%)*
6 Phương pháp Tính toán Có sẵn:
- BullBearRatio: Tỷ lệ nến Tăng/Giảm
- VolumePattern: Phân tích xu hướng khối lượng
- BodySizePattern: Phân tích kích thước thân nến
- WickPattern: Phân tích mẫu bấc nến
- GapPattern: Phát hiện & phân tích khoảng trống
- ConsecutivePattern: Phân tích chuyển động giá liên tiếp
🔧 Tham số Có thể Tùy chỉnh:
- Khoảng thời gian phân tích *(5-30)*
- Sử dụng khối lượng trong tính toán (tùy chọn)
⚙️ Tính năng Nâng cao
🔹 Hệ thống Trọng số Linh hoạt
- Trọng số tùy chỉnh cho từng thành phần *(0-100%)*
- Tự động chuẩn hóa nếu tổng trọng số không bằng 100%
- Cảnh báo cho cấu hình không tối ưu
🔹 Làm mượt Thông minh
- Tùy chọn làm mượt để giảm nhiễu
- Khoảng thời gian làm mượt có thể điều chỉnh *(1-10)*
- Bộ lọc SMA áp dụng cho kết quả cuối cùng
🔹 Hiển thị Hoàn toàn Tùy chỉnh
- Kích thước đồng hồ đo *(50-500px)*
- Tần suất cập nhật *(1-50 thanh)*
- Phân tích thành phần tùy chọn (hiển thị giá trị riêng lẻ)
- Tự động thích ứng với công cụ & khung thời gian
🔄 Quá trình Thuật toán
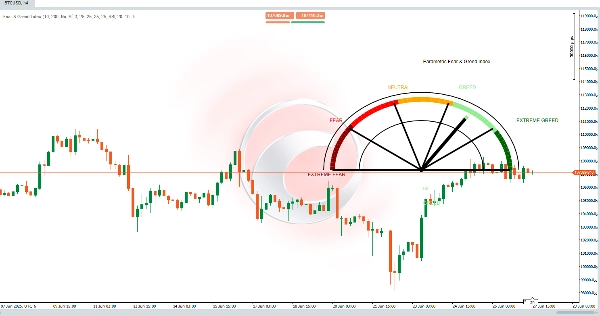
Bước 4: Trực quan hóa
Đồng hồ đo hình bán nguyệt hiển thị 5 vùng màu:
- 0-20: Sợ hãi Cực độ
- 21-40: Sợ hãi
- 41-60: Trung lập
- 61-80: Tham lam
- 81-100: Tham lam Cực độ
✅ Hệ thống Hoàn toàn Tùy chỉnh:
🎯 Linh hoạt Toàn diện
- Thích ứng với mọi thị trường: Forex, Crypto, Cổ phiếu, Hàng hóa
- Cụ thể theo khung thời gian: Cài đặt khác nhau cho giao dịch lướt sóng và giao dịch dao động
- Phát triển cùng thị trường: Điều chỉnh chiến lược khi điều kiện thay đổi
Tóm tắt
Đánh giá của khách hàng
5 | 100 % | |
4 | 0 % | |
3 | 0 % | |
2 | 0 % | |
1 | 0 % |