Volume_Momentum_HeatMap-Liquidity-style
Indicateur
Version 2.0, Apr 2026
Windows, Mac
4.5
Avis : 4
Description
Pourquoi cet indicateur est précieux pour les traders
- Identifie les niveaux clés : POC, VAH et VAL sont des niveaux objectifs de support/résistance.
- Trading basé sur le volume : Aide les traders à voir où la liquidité est concentrée.
- Adaptable : Fonctionne sur n'importe quelle unité de temps et classe d'actifs (forex, actions, crypto, etc.).
- Personnalisable : Les traders peuvent ajuster les paramètres selon leur style.
- De qualité professionnelle : Utilisé par les traders institutionnels et particuliers pour l'analyse du flux d'ordres.
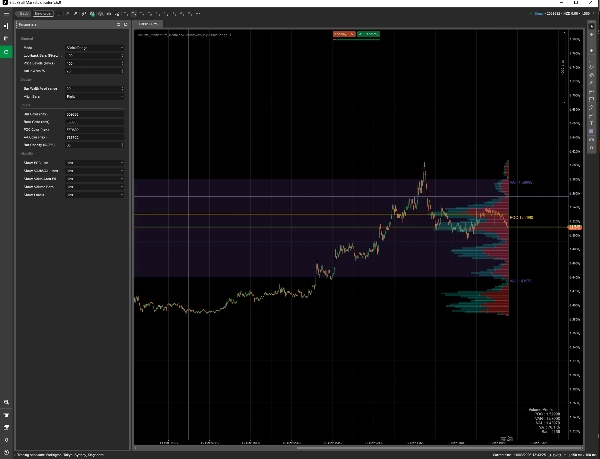
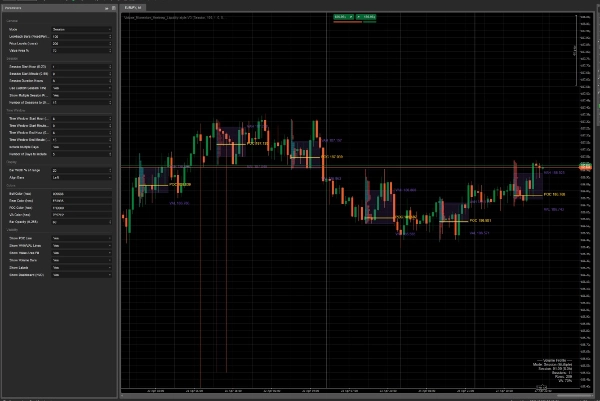
Éléments visuels - POC (Point de Contrôle) : Le niveau de prix avec le volume le plus élevé (ligne jaune). Agit comme un aimant pour le prix.
- VAH/VAL (Haut/Bas de la zone de valeur) : Les limites supérieure et inférieure de la zone de valeur à 70 % (par défaut), où 70 % du volume s'est produit. Cette zone agit souvent comme support/résistance.
- Remplissage de la zone de valeur : Une bande semi-transparente entre VAH et VAL, mettant visuellement en évidence la zone de valeur.
- HVN (Nœuds de volume élevé) : Barres larges indiquant des zones fortes de support/résistance.
- LVN (Nœuds de faible volume) : Barres fines indiquant des zones où le prix évolue rapidement (zones de cassure/course aux stops).
2. Modes de profil
- Plage visible : S'adapte à la vue actuelle du graphique (zoom/défilement).
- Retour fixe : Utilise les N dernières barres (configurable).
- Session : Affiche uniquement le volume pour la journée de trading en cours.
3. Options de personnalisation
- Lignes : Nombre de niveaux de prix (lignes) à afficher.
- % de la zone de valeur : Ajuste le pourcentage de volume à inclure dans la zone de valeur (par défaut : 70 %).
- Largeur et alignement des barres : Contrôle la largeur et l'alignement des barres de volume.
- Couleurs et opacité : Personnalise les couleurs pour le volume haussier/baissier, POC, VA et l'opacité.
- Visibilité : Active/désactive POC, VAH/VAL, remplissage de la zone de valeur, barres de volume et étiquettes.
4. Stratégies de trading prises en charge
- Retracements HVN : Trade les rebonds au POC ou aux nœuds de volume élevé.
- Cassures LVN : Entrez dans des trades momentum lorsque le prix franchit les nœuds de faible volume.
- Fade de la zone de valeur : Contre les mouvements en dehors de la zone de valeur (réversion à la moyenne).
- Biais d'ouverture quotidienne : Compare l'ouverture quotidienne au POC pour la direction de la tendance.
Questions et réponses potentielles des acheteurs
- Q : Fonctionne-t-il sur toutes les unités de temps ?
R : Oui, il s'adapte à n'importe quelle unité de temps et vue du graphique. - Q : Puis-je changer les couleurs ?
R : Oui, toutes les couleurs et l'opacité sont personnalisables. - Q : Est-il adapté au scalping ?
R : Absolument, surtout avec le mode « Session » pour le trading intrajournalier. - Q : Est-ce qu'il repeint ?
R : Non, il ne recalcule que lorsque de nouvelles données sont disponibles ou que la vue du graphique change.
Résumé
Profil de l'indicateur
Catégorie de l'indicateur
Dynamique
Type de résultat
Visualisation
Exigences en matière de données
Volume
Signaux pris en charge
Volatilité
Atteinte du niveau
Écart d'ouverture de session
Avis clients
4.5
Avis : 4
5 | 50 % | |
4 | 50 % | |
3 | 0 % | |
2 | 0 % | |
1 | 0 % |
Avis clients
March 31, 2026
Not some auto win thing, but it has a clear role. It helps with smart money style analysis, while the weak spot is that zones still need manual validation. Early sizing should stay modest until the journal looks stable.
March 24, 2026
Tbh the value is mostly in filtering bad ideas. I still would not trust it live without checking the chart myself. The weak spot shows up when risk stops matching the setup.705 caution area.
March 22, 2026
the product feels more useful when the plan is already written down. A 97 setup run on daily close keeps the review grounded.
March 22, 2026
After 3 sessions, the useful part became clearer. 20 FVG reactions was enough to see whether it helped, and 0.5 mitigation kept the test grounded.
Discussion
Questions fréquentes
Scalping
Les produits disponibles sur cTrader Store, notamment les bots de trading, les indicateurs et les plug-ins, sont fournis par des développeurs tiers et mis à disposition à titre informatif et à des fins d'accès technique uniquement. cTrader Store n'est pas un courtier et ne fournit aucun conseil en investissement, aucune recommandation personnelle ni aucune garantie quant aux performances futures.
Plus de cet auteur

Vous pourriez aussi aimer


![Logo de "Wyckoff Toolkit [Iridio Capital]"](https://cdn.ctrader.com/image/webp/8acfe6a1-6a8e-4578-9367-9df3af2b1801_27763)


Prix
Depuis le 23/04/2025
2
Ventes