
Description
Indicateur de Chasse aux Baleines – Académie Bukhari
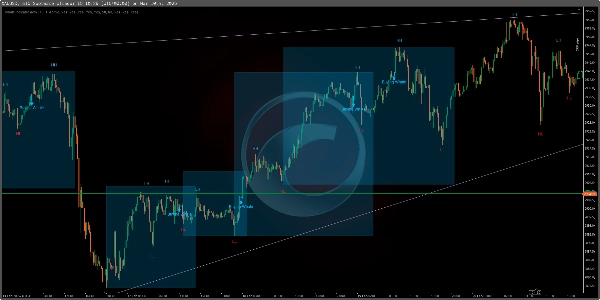
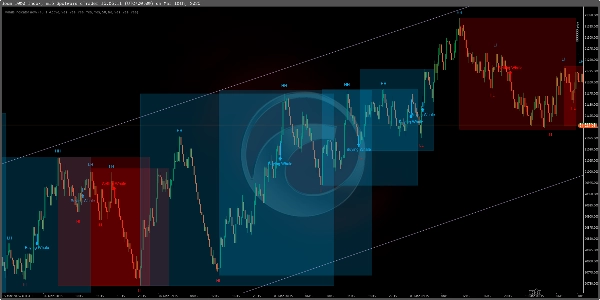
L’Indicateur de Chasse aux Baleines est un puissant outil de trading conçu spécifiquement pour les indices Boom & Crash et indices de Volatilité. Il comprend un Détecteur de Tendance Automatique, détecte les tendances haussières et baissières, marque les points de structure du marché (HH, HL, LH, LL), et fournit des signaux d’achat et de vente haute précision pour aider les traders à prendre des décisions éclairées.
Caractéristiques clés :
✅ Détecteur de Tendance Automatique – Identifie automatiquement les tendances du marché, réduisant le besoin d’analyse manuelle.
✅ Conçu pour les indices Boom & Crash et Volatilité – Optimisé pour trader ces marchés synthétiques.
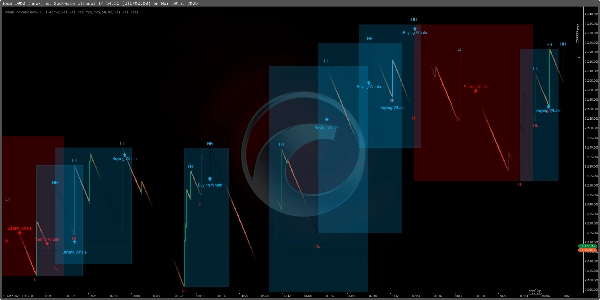
✅ Détection de pics sur Boom & Crash (période M1) – Identifie les pics potentiels sur M1, aidant les traders à saisir les mouvements rapides des prix.
✅ Identification des tendances sur M15 – Fonctionne efficacement sur M15 pour l’analyse normale des tendances et les configurations de trading structurées.
✅ Analyse de la structure du marché – Affiche les Plus Hauts Plus Hauts (HH), Plus Bas Plus Hauts (HL), Plus Hauts Plus Bas (LH) et Plus Bas Plus Bas (LL) pour une meilleure compréhension des tendances.
✅ Signaux d’entrée Baleine – Met en évidence les points « Baleine Acheteuse » et « Baleine Vendeuse » pour des entrées de trade précises.
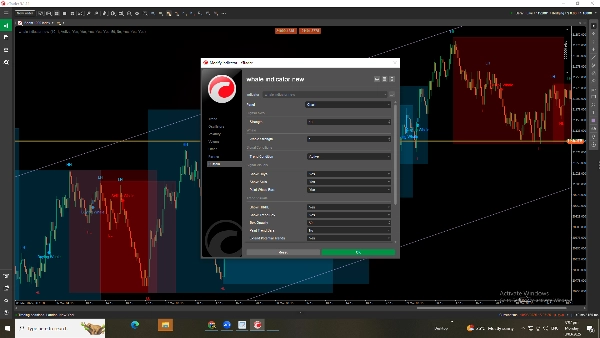
✅ Paramètres entièrement personnalisables – Ajustez la force de la baleine, la sensibilité des signaux et les conditions de tendance pour affiner votre approche de trading.
✅ Activation/Désactivation des fonctionnalités – Activez ou désactivez les boîtes de tendance, les points de structure et les signaux d’achat/vente selon vos besoins.
Comment utiliser l’Indicateur de Chasse aux Baleines ?
1️⃣ Détection automatique de tendance – Laissez l’indicateur identifier automatiquement la direction de la tendance.
2️⃣ Trader les pics Boom & Crash sur M1 – Recherchez des signaux sur M1 pour saisir efficacement les pics de prix.
3️⃣ Analyser les tendances du marché sur M15 – Utilisez M15 pour une analyse structurée des tendances et la confirmation des trades.
4️⃣ Suivre la structure du marché – Utilisez HH, HL, LH, LL pour comprendre la direction et la force de la tendance.
5️⃣ Rechercher les signaux Baleine – Entrez en position aux points « Baleine Acheteuse » ou « Baleine Vendeuse ».
6️⃣ Personnaliser pour plus de précision – Ajustez la force de la baleine et la sensibilité des signaux pour optimiser les résultats.
7️⃣ Activation/Désactivation des fonctionnalités – Modifiez les conditions de tendance et les paramètres de structure selon votre stratégie.
Cet indicateur est parfait pour les indices Boom & Crash et Volatilité, offrant des opportunités de trading à haute probabilité avec précision et efficacité. 🚀
Résumé
Key functionalities include spike detection on the M1 timeframe for Boom & Crash indices to capture rapid price movements, and trend identification on the M15 timeframe for structured trade setups. Users can customize settings such as whale strength, signal sensitivity, and trend conditions to refine their trading approach. Features like trend boxes, structure points, and buy/sell signals can be enabled or disabled according to user preference.
The indicator supports efficient analysis and trade execution in synthetic markets, offering tools for both short-term spike trading and longer-term trend analysis. It is suitable for traders focusing on Boom & Crash and Volatility indices who seek precise market insights and customizable signal options.
Avis clients
5 | 33 % | |
4 | 67 % | |
3 | 0 % | |
2 | 0 % | |
1 | 0 % |


