
الوصف
مقدمة إلى ADX
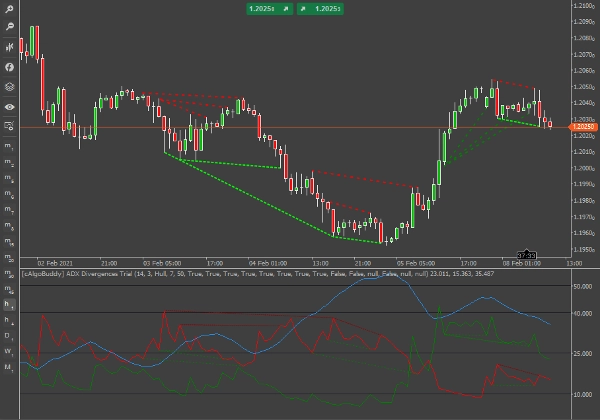
يتم رسم ADX (الخط الأزرق) كخط واحد بقيم تتراوح من صفر إلى 100. ADX هو غير اتجاهي؛ فهو يسجل قوة الاتجاه سواء كان السعر يتجه صعودًا أو هبوطًا. عادةً ما يتم رسم المؤشر في نفس النافذة مع خطي مؤشر الحركة الاتجاهية (Di+ و Di-) اللذين يُشتق منهما ADX.
يرصد هذا المؤشر التباينات على خطوط Di+ و Di-. على عكس المؤشرات الأخرى التي ترصد التباينات، يمكننا مع هذا المؤشر استخراج معلومات أكثر قيمة من النظيرين الآخرين لإشارة التباين. على سبيل المثال، إذا حدث تباين على Di+، يمكننا تقييم الإشارة مع الأخذ في الاعتبار مستويات Di- و ADX.
يتم تنعيم خطوط Di+ و Di- جزئيًا باستخدام المتوسط المتحرك هول على 3 فترات. للحصول على تباين كامل بنسبة 100٪، يمكنك ضبط فترة المتوسط المتحرك على 1 ونوع المتوسط المتحرك إلى بسيط. ومع ذلك، نظرًا لأننا نرسم التباينات على خطين في نفس نافذة المؤشر، قد تشعر أحيانًا بالإرهاق من الإشارات. من ناحية أخرى، يمكنك اختيار أنواع التباينات التي تريد رؤيتها ولأي خط (Di+ أو Di-) من إعدادات المؤشر.
تعتبر إشارة التباين مؤكدة عند افتتاح الشمعة التي تلي التباين. ومع ذلك، بسبب الطبيعة "غير المرنة" لخطوط اتجاه ADX (مقارنةً، على سبيل المثال، بـ RSI) كلما ظهر خط تباين، من المحتمل أن يبقى هناك حتى شمعة التأكيد، ما لم تحدث تقلبات شديدة.
قبل التداول على أي إشارة تباين، حدد ما يلي:
- اتجاه ومستوى ADX
- المسافة بين Di+ و Di-
- اتجاه ومستوى Di+
- اتجاه ومستوى Di-
أيضًا، ضع في اعتبارك
- تجنب اتخاذ أي صفقة تباين عندما يكون ADX منخفضًا (أقل من 15 واتجاه هابط)، حيث يجب أخذ الإشارات بناءً على الاتجاهات التي تم تطويرها بالفعل أو التي في طور التطور.
- أيضًا، ضع في اعتبارك أن تقاطع Di+ و Di- يعتبر إشارة صعودية/هبوطية بحد ذاته، لذا قم بتعديل مراكزك وفقًا لذلك.
- في حالة حدوث تباين في كل من Di+ و Di- على نفس الشمعة، اختر الخط المناسب الأفضل اعتمادًا على الاتجاه (اتجاه صعودي/إشارة صعودية Di+، اتجاه هبوطي/إشارة هبوطية Di-).
- ليس عليك التداول على كل إشارة.
التباينات على DiPlus
DiPlus (الأخضر) هو الخط الذي يرسم قوة الاتجاه الصعودي. يمكننا رصد التباينات بين قوة الاتجاه الصعودي بطريقة مشابهة لمعظم المؤشرات المتذبذبة.
تباين صعودي منتظم
التعريف: السعر صنع قاعًا أدنى لكن المؤشر صنع قاعًا أعلى. النتيجة المثالية هي: بعد ارتفاع صعودي طفيف، يجب أن نرى تطور اتجاه هبوطي. يتم رسمه بخط أخضر فاتح منقط في نافذتي السعر والمؤشر.
اتجاه هبوطي مهيمن يبدأ في التطور أو قد تطور بالفعل. ندخل صفقة بيع بعد حدوث التصحيح الصغير. في بعض الحالات، يمكن أن يحدث التباين على Di+ على شمعة هبوطية، وهو تأكيد جيد للاتجاه الهبوطي المهيمن.
أحيانًا، سيطور الارتفاع الصعودي اتجاهًا صعوديًا. يمكن أن يحدث هذا عندما يكون هناك اتجاه قليل أو لا يوجد اتجاه (Di+ و Di- قريبان من بعضهما البعض، ADX< 20) أو بعد استنفاد الاتجاه الهبوطي عند مستويات المقاومة.
تباين صعودي مخفي
التعريف: السعر صنع قاعًا أعلى والمؤشر صنع قاعًا أدنى. يجب أن نتوقع تطورًا أو استمرارًا للاتجاه الصعودي. يتم رسمه بخط أخضر داكن منقط جزئيًا في نافذتي السعر والمؤشر.
اتجاه صعودي مهيمن يبدأ في التطور أو قد تطور بالفعل. ندخل صفقة شراء بعد حدوث التصحيح الصغير. يجب وضع وقف الخسارة حول أدنى نقطة في شمعة التباين.
واحدة من أفضل إشارات هذا المؤشر، خاصة لأننا نتوقع استمرار الاتجاه فورًا ويمكننا تقليل وقف الخسائر إلى الحد الأدنى.
تباين هبوطي منتظم
التعريف: السعر صنع قمة أعلى لكن المؤشر صنع قمة أدنى. بعد هبوط هبوطي طفيف، يجب أن نرى تطور اتجاه صعودي. يتم رسمه بخط أحمر داكن منقط في نافذتي السعر والمؤشر.
الاتجاه الصعودي المهيمن لا يزال في ارتفاع (ADX لا يزال يرتفع في وقت التباين).
الظروف التي تحدث فيها هذه الحالة نادرة جدًا لأن Di+ يمثل قوة صعودية. عادةً ما تحدث الظروف بعد استنفاد الاتجاه الصعودي، مما يعني أنها "القمة" النهائية قبل أن يبدأ الاتجاه الهبوطي في التطور. لذلك، يُنصح في معظم الأوقات بالدخول في صفقة بيع على هذه الإشارة.
تباين هبوطي مخفي
التعريف: السعر صنع قمة أدنى والمؤشر صنع قمة أعلى. يجب أن نتوقع استمرار الاتجاه الهبوطي. يتم رسمه بخط أحمر منقط جزئيًا في نافذتي السعر والمؤشر.
اتجاه هبوطي مهيمن مع ارتفاعات صعودية (ADX لا يزال يرتفع في وقت التباين).
طلب استمرار الاتجاه الهبوطي من خط الاتجاه الصعودي هو أمر غير بديهي، ولهذا يجب أخذ هذه الإشارة بحذر شديد. غالبًا ما يدخل السوق في مرحلة تماسك بعد هذا التباين.
في سوق بلا اتجاه، تجنب اتخاذ صفقة. في اتجاه هبوطي مستنفد، إذا اخترت الدخول في صفقة بيع، قم بالتداول السريع.
التباينات على DiMinus
DiMinus (الأحمر) هو الخط الذي يرسم قوة الاتجاه الهبوطي. الطريقة التي نرصد بها التباينات على السعر و DiMinus هي عكس الطريقة التي نرصد بها التباينات على DiPlus.
تباين صعودي منتظم
التعريف: السعر صنع قاعًا أدنى لكن المؤشر صنع قمة أدنى (بدلًا من قاع أعلى). بعد ارتفاع صعودي طفيف، يجب أن نرى تطور اتجاه هبوطي. يتم رسمه بخط أخضر فاتح منقط في نافذة السعر وخط أحمر داكن منقط في نافذة المؤشر.
اتجاه هبوطي مهيمن يبدأ في التطور أو قد تطور بالفعل. ندخل صفقة بيع بعد حدوث التصحيح الصغير. في بعض الحالات، يمكن أن يحدث التباين على Di- على شمعة هبوطية، وهو تأكيد جيد للاتجاه الهبوطي المهيمن.
تمامًا مثل الإشارة القادمة من نظير Di+، أحيانًا سيطور الارتفاع الهبوطي اتجاهًا هبوطيًا. يمكن أن يحدث هذا عندما يكون هناك اتجاه قليل أو لا يوجد اتجاه (Di+ و Di- قريبان من بعضهما البعض، ADX< 20) أو بعد استنفاد الاتجاه الصعودي عند مستويات المقاومة.
تباين صعودي مخفي
التعريف: السعر صنع قاعًا أعلى والمؤشر صنع قمة أعلى (بدلًا من قاع أدنى). يجب أن نتوقع استمرار الاتجاه الصعودي. يتم رسمه بخط أخضر منقط جزئيًا في نافذة السعر وخط أحمر داكن منقط جزئيًا في نافذة المؤشر.
من غير البديهي طلب استمرار الاتجاه الصعودي من خط اتجاه Di-. نحتاج إلى وجود ارتفاعات هبوطية في اتجاه صعودي.
تباين هبوطي منتظم
التعريف: السعر صنع قمة أعلى لكن المؤشر صنع قاعًا أعلى (بدلًا من قمة أدنى). بعد هبوط هبوطي في السعر، يجب أن نرى استمرار الاتجاه الصعودي. يتم رسمه بخط أحمر داكن منقط في نافذة السعر وخط أخضر فاتح منقط في نافذة المؤشر.
يوصى، في اتجاه صعودي قوي ومتطور، بالدخول في صفقة شراء. ولكن، في سوق صعودي مستنفد ومنهك، ادخل صفقة بيع.
تباين هبوطي مخفي
السعر صنع قمة أدنى والمؤشر صنع قاعًا أدنى (بدلًا من قمة أعلى). يجب أن نتوقع استمرار الاتجاه الهبوطي. يتم رسمه بخط أحمر منقط جزئيًا في نافذة السعر وخط أخضر منقط جزئيًا في نافذة المؤشر.
واحدة من أفضل إشارات هذا المؤشر، خاصة لأننا نتوقع استمرار الاتجاه الهبوطي فورًا ويمكننا تقليل وقف الخسائر إلى الحد الأدنى. يجب وضع وقف الخسارة عند أدنى نقطة في شمعة التباين.
تنبيهات رسائل تيليجرام الفورية
نظرًا لأن لديك بوت وقناة معدة في تيليجرام، سيرسل لك مؤشر تباينات ADX رسائل للإشارات المؤكدة على زوج العملات الذي تستخدمه عليه. ضع في اعتبارك أنك ستحصل على إشارات فقط للخيارات التي اخترت "نعم" لعرضها. يمكنك تكوين هذا الروبوت التداولي أيضًا لإرسال تنبيهات تيليجرام الفورية مباشرة إلى جهاز الكمبيوتر أو الجهاز اللوحي أو الهاتف المحمول الخاص بك.
مهم: يرجى التأكد من ضبط المنطقة الزمنية بشكل صحيح على توقيتك المحلي (أسفل الزاوية اليمنى من التطبيق).
تنبيهات سطح المكتب
إذا اخترت نعم، سيرسل مؤشر تباينات ADX إشعارًا في مربع رسالة على سطح المكتب الشخصي الخاص بك عند تأكيد الإشارات.
تنبيهات البريد الإلكتروني
لكي تعمل هذه الوظيفة، يجب أولاً تكوين cTrader الخاص بك ليتمكن من إرسال رسائل البريد الإلكتروني (الإعدادات-> البريد الإلكتروني). إذا اخترت نعم، سيرسل مؤشر تباينات ADX بريدًا إلكترونيًا على الإشارات المؤكدة إلى العنوان الذي أدخلته.
الملخص
This indicator detects divergences on both Di+ and Di- lines, allowing traders to analyze signals with additional context from the other directional lines and ADX levels. The Di+ and Di- lines are smoothed using a Hull moving average, adjustable via settings to control signal sensitivity and display preferences.
Divergence signals are confirmed at the opening of the bar following the divergence, with guidance provided on interpreting various divergence types—regular and hidden bullish and bearish divergences—on both Di+ and Di- lines. Users are advised to consider ADX levels, the distance between Di+ and Di-, and the direction and level of each line before trading signals.
The indicator supports instant alerts via Telegram messages, desktop notifications, and email, configurable within the platform. Proper time zone settings are required for accurate alert timing. This tool is applicable across multiple markets including Forex, commodities, indices, stocks, and cryptocurrencies such as BTCUSD and XAUUSD.
تقييمات العملاء
5 | 100 % | |
4 | 0 % | |
3 | 0 % | |
2 | 0 % | |
1 | 0 % |


