
الوصف
الغرض من خوارزمية cTrader لمؤشر Boxify هو محاولة وضع حركة السعر في مناطق، أو بشكل أفضل، صناديق. بهذه الطريقة، يمكن للمتداول الحصول على ميزة في مواقعه التداولية. هذا ليس مؤشراً يمكن الاعتماد عليه بمفرده، بل هو أداة جيدة يمكن أن تكمل أي استراتيجية أو إعداد تداول.
يمكن أن يساعد اكتشاف الحركة الجانبية المتداول على تأمين الأرباح، تقليل الخسائر أو وضع أوامر محددة لصالحه. هذه بعض الطرق التي يمكننا استخدام الصندوق بها:
كشف مناطق التوحيد
بالنسبة للصناديق السابقة التي تحتوي على عدة أشرطة بداخلها، يمكننا الافتراض بأمان أن هذه مناطق توحيد وأن لدينا حركة جانبية. يمكن أن تخدم هذه المناطق كمستويات دعم أو مقاومة في تحليلك لحركة السعر.
وضع تداولاتك بشكل أفضل
في حال كان لديك إعداد لتداول ورأيت السعر يتشكل في صندوق، يمكنك دائماً استخدام الصندوق كدليل لحركة السعر، للحصول على موقع أكثر فائدة لتداولك. يمكن استخدام الصندوق الذي يتشكل حالياً إما لتأمين بعض الأرباح في موقع رابح، إعادة الدخول في سوق متجه أو وضع أوامر وقف الخسارة.
وضع أوامر محددة
الحركة الجانبية الطويلة ستؤدي في النهاية إلى اختراقات. يمكن لـ Boxify مساعدتك في وضع أوامر محددة، فوق أو تحت، للحصول على أقصى استفادة من بداية الاختراق.
خيارات المؤشر
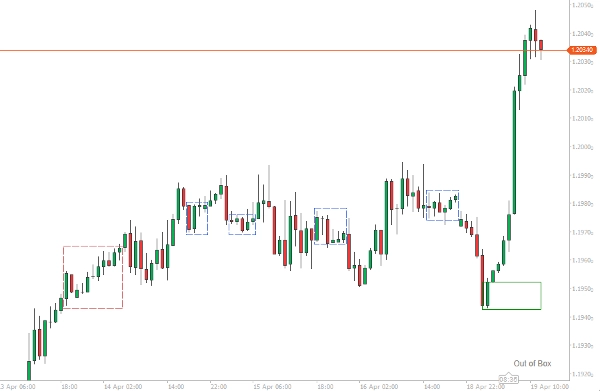
سيحاول المؤشر وضع السعر في صندوق من على الأقل شريطين وما فوق. ستظهر رسائل من المؤشر في الزاوية اليمنى السفلى من منطقة الرسم البياني.
- إذا كان السعر في اتجاه، ستظهر الرسالة "خارج الصندوق".
- إذا كان السعر في صندوق، ستظهر الرسالة "داخل الصندوق".
- إذا كان السعر في صندوق وكسر الحد الأعلى، ستظهر الرسالة "اختراق عالي".
- إذا كان السعر في صندوق وكسر الحد الأدنى، ستظهر الرسالة "اختراق منخفض".
تعتبر الصناديق مكتملة عند فتح شريط جديد، حيث يمكن للسعر دائماً أن يعود إلى داخل الصندوق.
الحد الأدنى للأشرطة للصندوق
يمثل هذا الرقم الحد الأدنى لعدد الأشرطة التي يجب أن يحتويها الصندوق ليعتبر مكتملًا. استخدم أرقامًا أقل لنقاط الدخول، وأرقامًا أعلى لمناطق التوحيد.
مرشح ATR
يحتوي Boxify داخليًا على مؤشر ATR، يمكنك استخدامه كخيار تصفية، في حال أردت إيقاف تشكيل الصندوق على أي شريط يتجاوز طوله (الأعلى-الأدنى) قيمة ATR. استخدم هذا الخيار إذا كنت تريد الدخول في تداولات.
دمج التداخلات
يمكن أن يبدأ بداية الصندوق قبل انتهاء الصندوق السابق (خاصة إذا اخترنا رقمًا منخفضًا جدًا لطول الصندوق). يمكننا دمج هذه الصناديق باستخدام هذا الخيار، حتى نتمكن من رؤية صندوق أكبر يتشكل – ستكون هذه الصناديق ذات حدود زرقاء اللون.
التسامح
رقم يعكس التسامح الذي يمكن أن تتحمله الحدود العلوية/السفلية للصناديق. يجب استخدام أرقام صغيرة عندما نريد الدخول في تداولات، وأرقام أكبر عندما نريد إيجاد مناطق توحيد.
الملخص
تقييمات العملاء
5 | 33 % | |
4 | 67 % | |
3 | 0 % | |
2 | 0 % | |
1 | 0 % |


