
الوصف
مؤشر القمم والقيعان الرئيسية: نظرة شاملة
مقدمة
في عالم التداول السريع، يمكن أن تحدث الأدوات المناسبة فرقًا كبيرًا. تم تصميم مؤشر القمم والقيعان الرئيسية لتحديد نقاط التحول الحرجة في السوق، مما يسمح للمتداولين باتخاذ قرارات مستنيرة. يستخدم هذا الأداة القوية خوارزميات متقدمة لتحديد القمم والقيعان المهمة، مما يعزز استراتيجيتك في التداول ويحسن أدائك العام. مع معدل دقة متوسط يتراوح بين 60٪ إلى 70٪ على إطار زمني 45 دقيقة، يعد هذا المؤشر أداة موثوقة للمتداولين الذين يسعون للاستفادة من تحركات السوق، مما يجعله مثاليًا لكل من المتداولين اليوميين والمضاربين السريعين.
الميزات الرئيسية
1. التمثيل البصري
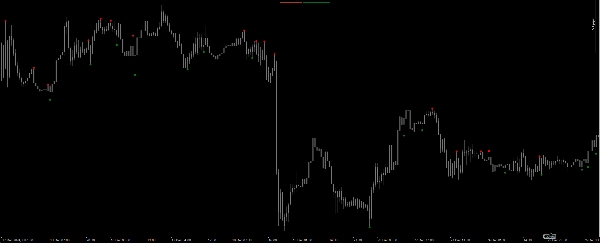
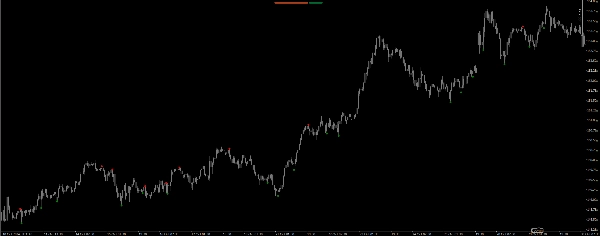
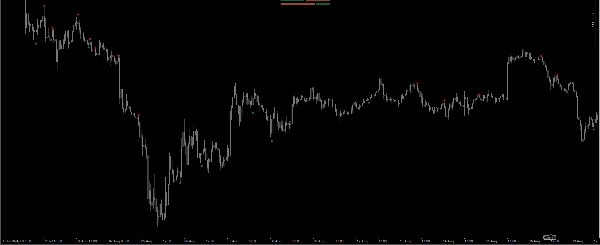
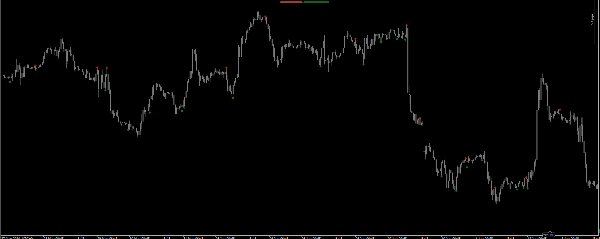
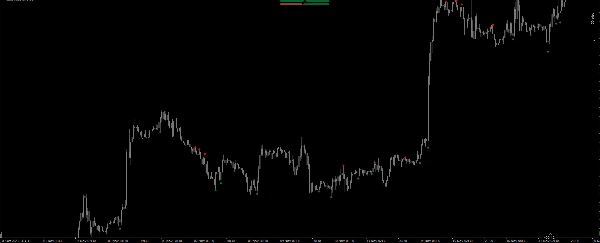
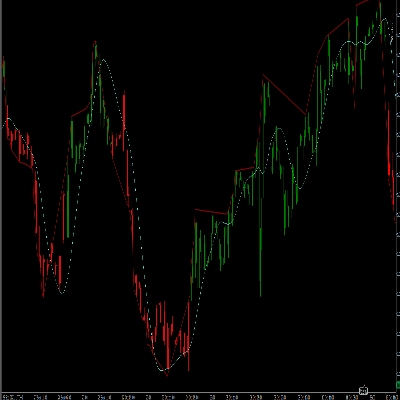
يوفر مؤشر القمم والقيعان الرئيسية تمثيلًا بصريًا واضحًا لديناميكيات السوق. مع تمييز القمم الرئيسية باللون الأحمر والقيعان الرئيسية باللون الأخضر، يمكن للمتداولين تحديد نقاط الانعكاس المحتملة بسرعة. يضمن استخدام النقاط بروز هذه المستويات الحرجة على الرسم البياني، مما يسهل اكتشاف فرص التداول بنظرة سريعة.
2. حسابات دقيقة
يكمن جوهر مؤشر القمم والقيعان الرئيسية في طريقة حسابه. من خلال تحليل حركة السعر لأربعة أشرطة أخيرة، يحدد المؤشر ما إذا كانت قمة أو قاع رئيسي قد تشكل. يتم تحقيق ذلك من خلال سلسلة من المقارنات بين أسعار القمة والقاع، مما يضمن تحديد نقاط التحول المهمة فقط.
3. تقنيات مضاعفة محسنة
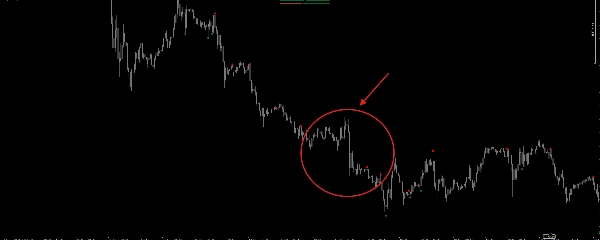
بالنسبة للمتداولين المتخصصين في المضاربة السريعة، يعد مؤشر القمم والقيعان الرئيسية أداة لا تقدر بثمن. من خلال تحديد نقاط التحول الرئيسية، يمكن للمتداولين الدخول والخروج من المراكز بدقة. تتيح القدرة على اكتشاف القمم والقيعان الرئيسية بسرعة وضع أوامر جني الأرباح (TP) ووقف الخسارة (SL) بشكل محكم، مما يقلل المخاطر مع تعظيم الأرباح المحتملة. نظرًا لدقته التي تتراوح بين 60٪ إلى 70٪ على أطر زمنية 45 دقيقة، يُنصح بشدة باستخدام أوامر وقف الخسارة لتقليل الخسائر المحتملة عند فقدان إشارة.
فوائد استخدام مؤشر القمم والقيعان الرئيسية
1. تحسين اتخاذ القرار
يمكن مؤشر القمم والقيعان الرئيسية المتداولين من اتخاذ قرارات مستنيرة بناءً على تحليل دقيق للسوق. من خلال تحديد القمم والقيعان المهمة، يمكن للمتداولين توقع تحركات الأسعار بشكل أفضل وتعديل استراتيجياتهم وفقًا لذلك. يعزز هذا التحسين في عملية اتخاذ القرار الأداء العام للتداول.
2. زيادة إمكانات الربح
مع القدرة على تحديد نقاط التحول الحرجة، يمكن للمتداولين الاستفادة بشكل أكثر فعالية من انعكاسات السوق. يتيح مؤشر القمم والقيعان الرئيسية للمتداولين الدخول في المراكز في الأوقات المثلى، مما يزيد من إمكانات الربح لديهم. من خلال استخدام مستويات جني الأرباح ووقف الخسارة المحكمة، يمكن للمتداولين تعظيم أرباحهم مع تقليل تعرضهم للمخاطر.
3. واجهة سهلة الاستخدام
تم تصميم مؤشر القمم والقيعان الرئيسية مع مراعاة تجربة المستخدم. يضمن التمثيل البصري الواضح للقمم والقيعان الرئيسية أن يتمكن المتداولون من تفسير الإشارات التي يوفرها المؤشر بسهولة. تجعل هذه الواجهة سهلة الاستخدام المؤشر متاحًا للمتداولين من جميع مستويات الخبرة.
4. تطبيق متعدد الاستخدامات
سواء كنت متداول يومي، متداول تأرجحي، أو مضارب سريع، يمكن تطبيق مؤشر القمم والقيعان الرئيسية عبر استراتيجيات تداول مختلفة. تجعل مرونته إضافة قيمة إلى مجموعة أدوات أي متداول، مما يسمح بمرونة أكبر في التكيف مع ظروف السوق المختلفة.
خاتمة
في الختام، يعد مؤشر القمم والقيعان الرئيسية أداة قوية تعزز استراتيجيات التداول من خلال تحديد نقاط التحول الحرجة في السوق. مع حساباته الدقيقة، وتمثيله البصري، وتوافقه مع منصة cTrader، يمكن لهذا المؤشر تمكين المتداولين من اتخاذ قرارات مستنيرة والاستفادة من تحركات السوق. مع معدل دقة حوالي 70٪، من الضروري تنفيذ أوامر وقف الخسارة لتقليل الخسائر عند فقدان إشارة. للحصول على أفضل النتائج، يُنصح باستخدام هذا المؤشر على إطار زمني 45 دقيقة. سواء كنت متداولًا متمرسًا أو مبتدئًا، يمكن لمؤشر القمم والقيعان الرئيسية تحسين أدائك في التداول بشكل كبير. ارتقِ بتجربتك في التداول اليوم من خلال دمج هذه الأداة المبتكرة في استراتيجيتك.
الملخص
تقييمات العملاء
5 | 50 % | |
4 | 50 % | |
3 | 0 % | |
2 | 0 % | |
1 | 0 % |
![شعار "[Stellar Strategies] Smart ADX"](https://cdn.ctrader.com/image/webp/af13b084-b6f6-41db-b7bc-c7e688b57b05_36929)


