
VegaXLR - Auto Support and Resistance
Wskaźnik
5 zakupy
Wersja 1.0, Feb 2025
Windows, Mac
4.3
Opinie: 3
Opis
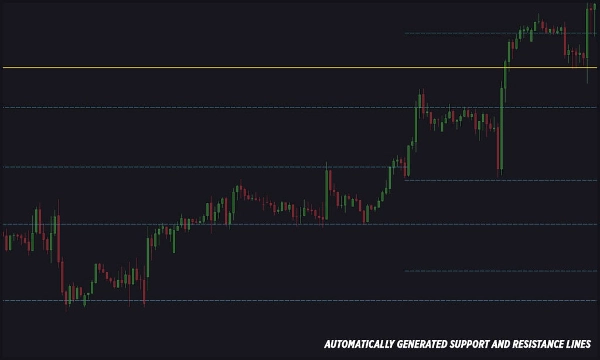
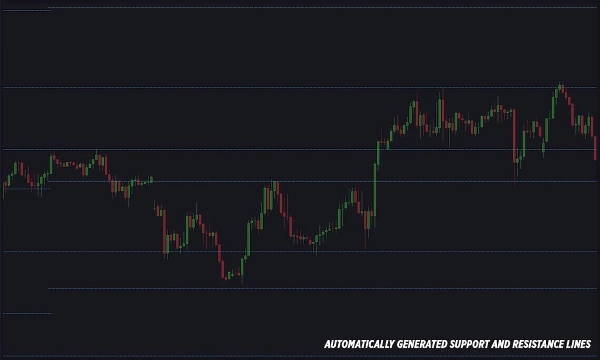
Ten wskaźnik cTrader automatycznie rysuje linie wsparcia i oporu na Twoim wykresie, co ułatwia korzystanie zarówno początkującym, jak i profesjonalistom. Linie są generowane na podstawie kluczowych poziomów Fibonacciego oraz wahnięć cenowych (zygzaków).
Funkcje:
- Automatyczne wykrywanie i rysowanie linii wsparcia i oporu.
- W pełni konfigurowalne style linii, grubość i kolory.
- Regulowana liczba linii wsparcia i oporu.
- Alerty, gdy cena wchodzi w interakcję z liniami wsparcia lub oporu.
- Wiele opcji alertów: Telegram, Email, wyskakujące okienka i dźwięki.
- Możliwość wyboru, które poziomy Fibonacciego generują linie.
- Opcja wyzwalania alertów z linii ceny Ask lub Bid.
- Konfigurowalne warunki alertów: alerty przy zamknięciu świecy lub natychmiastowe alerty przy dotknięciu ceny.
- Dostosowywalne wiadomości alertów z komentarzami definiowanymi przez użytkownika.
- Opcja włączania alertów tylko dla silnych poziomów wsparcia i oporu.
- Możliwość przechwytywania i wysyłania zrzutów ekranu wykresu przez Telegram (wykres musi być widoczny).
- Prosta konfiguracja alertów e-mail.
- Szybki dostęp do przewodnika użytkownika przez mały przycisk na wykresie.
Podsumowanie
Podsumowanie AI
VegaXLR - Auto Support and Resistance is a cTrader indicator that automatically identifies and draws support and resistance lines on trading charts. It uses key Fibonacci levels combined with price swing analysis (zigzags) to generate these lines, aiding traders in recognizing critical price levels. The indicator offers full customization of line styles, thickness, and colors, and allows adjustment of the number of support and resistance lines displayed.
It features real-time alerts triggered when price interacts with these levels, with configurable conditions such as bar-close or instant price-touch alerts. Alert notifications can be sent via multiple channels including Telegram, Email, pop-ups, and sounds. Users can specify which Fibonacci levels to use for line generation and choose whether alerts trigger from Ask or Bid price lines. Additional options include enabling alerts only for strong levels, customizing alert messages, and capturing chart screenshots to send via Telegram.
A user guide is accessible directly from the chart for ease of use. This tool supports Forex markets and is designed to assist both beginners and professionals in technical analysis by automating the detection of key support and resistance zones.
Profil wskaźnika
Opinie klientów
4.3
Opinie: 3
5 | 67 % | |
4 | 0 % | |
3 | 33 % | |
2 | 0 % | |
1 | 0 % |
Opinie klientów
March 2, 2025
Focused trade layer if the trader wants it keeps attention on levels that actually matter. It works best as support, not a final decision maker. The cleanest use is 3 to 5 levels per chart, with 0.5 pullbacks checked before entry. not every zone holds, even if it looks clean.
March 1, 2025
March 1, 2025
Balanced demo helper for traders who build plans around market levels. It gives value around key price zones, but not every zone holds, even if it looks clean. I would wait for 2 reactions and avoid trades where the target is less than 1.5R. Levels are useful when they reduce noise, not when they crowd the chart.
Dyskusja
Częste pytania
Forex
Produkty dostępne za pośrednictwem cTrader Store, w tym boty handlowe, wskaźniki i wtyczki, dostarczane są przez deweloperów zewnętrznych i udostępniane wyłącznie w celach informacyjnych oraz w celu zapewnienia dostępu technicznego. cTrader Store nie jest brokerem i nie zapewnia doradztwa inwestycyjnego, nie udziela spersonalizowanych rekomendacji ani nie gwarantuje przyszłych wyników.


Cena
215
Sprzedaż
680
Bezpłatne instalacje