
Descrizione
CVD ai
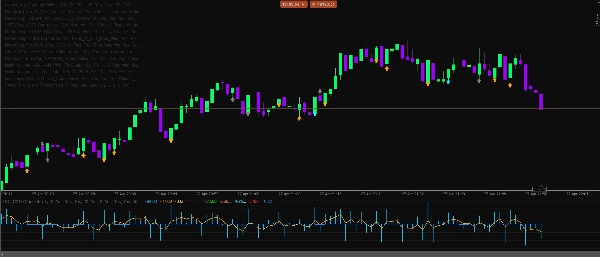
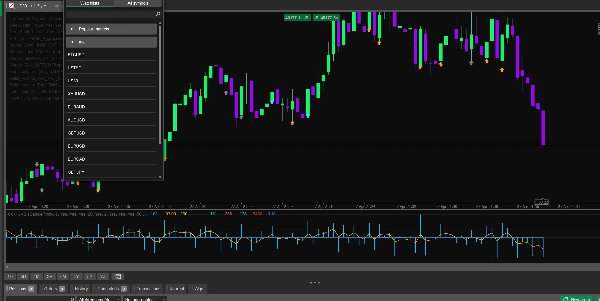
Delta CVD Advanced è un indicatore professionale di analisi del momentum e degli ordini progettato per i trader che desiderano una visione più chiara della pressione di acquisto e vendita direttamente dal comportamento del mercato. Combina Delta, CVD, momentum tick live, assorbimento, divergenza, filtri di sessione, guardie di volatilità e un motore di confluenza intelligente in un unico strumento analitico pulito.
Questo indicatore è costruito per lo scalping, il trading intraday e la conferma del momentum a breve termine su Forex, Oro, Indici, Cripto e mercati del Petrolio.
Caratteristiche principali
- Calcolo Delta live utilizzando la logica uptick/downtick
- Modalità delta proxy candela per analisi storica
- Linea Cumulative Volume Delta per tracciare la pressione nel tempo
- Linea Delta smussata per una lettura del momentum più pulita
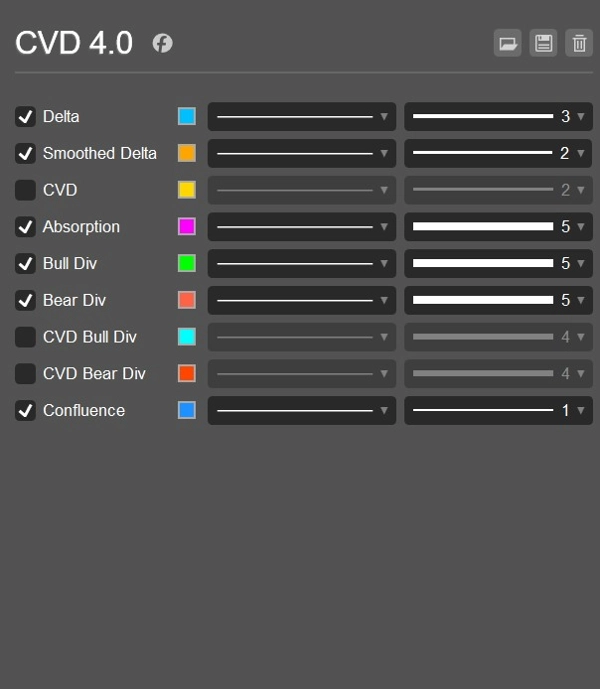
- Istogramma Delta colorato per acquisto/vendita
- Calcolo del momentum basato sui tick per l'impulso di mercato live
- Modalità momentum ibrida che combina pendenza CVD e impulso tick
- Opzioni di reset CVD: Mai, Giornaliero o per Sessione
- Rilevamento divergenza Delta rialzista e ribassista
- Rilevamento divergenza CVD rialzista e ribassista
- Rilevamento assorbimento per individuare pressione che non muove il prezzo
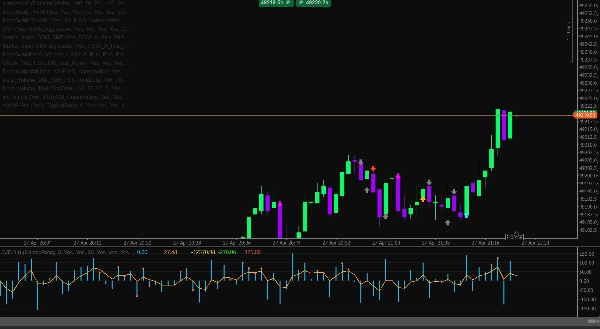
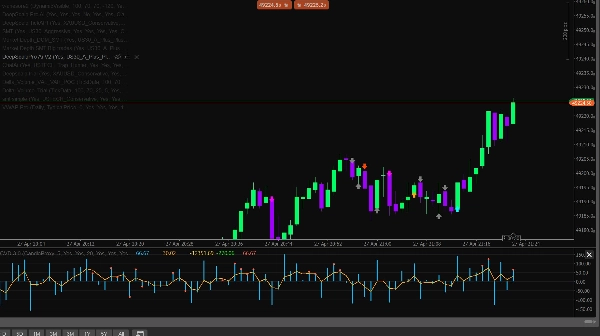
- Frecce segnale per opportunità di ACQUISTO e VENDITA
- Frecce di previsione per avvisi precoci di cambiamento di momentum
- Conferma CVD opzionale per i segnali
- Motore di confluenza intelligente con punteggio direzionale
- Filtro pressione proxy DOM
- Filtro rilevamento sweep per acquisizioni di liquidità
- Filtri di sessione per Asia, Londra e New York
- Rilevamento automatico della sessione usando l'ora UTC
- Guardia di volatilità usando limiti ATR
- Guardia spread per evitare condizioni di mercato sfavorevoli
- Filtro rapporto volume per evitare segnali deboli a basso volume
- Preset simboli per Forex, Oro, Indici, Cripto e Petrolio
- Template strategici per US30 M1, USTECH M1, XAUUSD M1, BTCUSD M1 e Oil M1
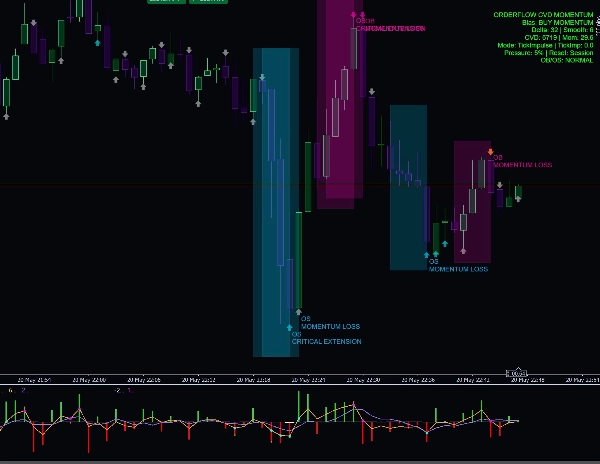
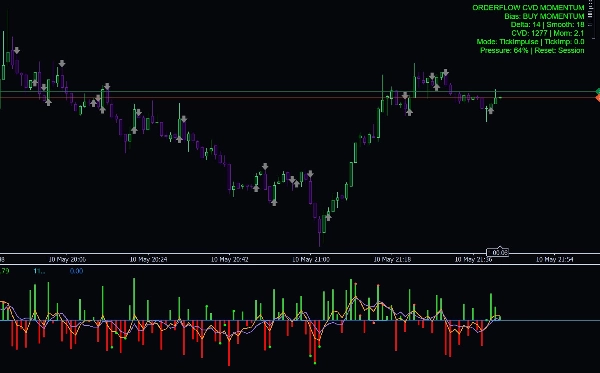
- Dashboard informativa che mostra bias, Delta, Delta smussato, CVD, Momentum, percentuale di pressione e modalità di reset
- Avvisi log opzionali con controllo cooldown
Perché i trader lo usano
Delta CVD Advanced aiuta i trader a capire chi è attualmente al controllo: acquirenti o venditori. Invece di affidarsi solo alle candele di prezzo, l'indicatore analizza la pressione dietro il movimento. Questo lo rende utile per confermare gli ingressi, evitare segnali deboli, identificare inversioni, individuare assorbimenti e rilevare cambiamenti di momentum prima che diventino evidenti sul prezzo.
La modalità momentum tick è particolarmente utile per lo scalping live perché reagisce agli impulsi di prezzo in tempo reale, mentre gli strumenti CVD e delta smussato aiutano a confermare se il movimento ha una reale forza dietro di sé.
Migliore utilizzo per
- Scalping
- Trading intraday
- Conferma del momentum
- Conferma di inversione
- Analisi sweep di liquidità
- Trading con divergenze Delta e CVD
- Oro, Indici, Cripto, Petrolio e coppie Forex
- M1, M5 e altri timeframe inferiori
Avviso importante
Questo indicatore è uno strumento analitico di supporto alle decisioni. Non garantisce profitti e dovrebbe essere utilizzato insieme a una corretta gestione del rischio, struttura di mercato e un piano di trading testato.
Riepilogo
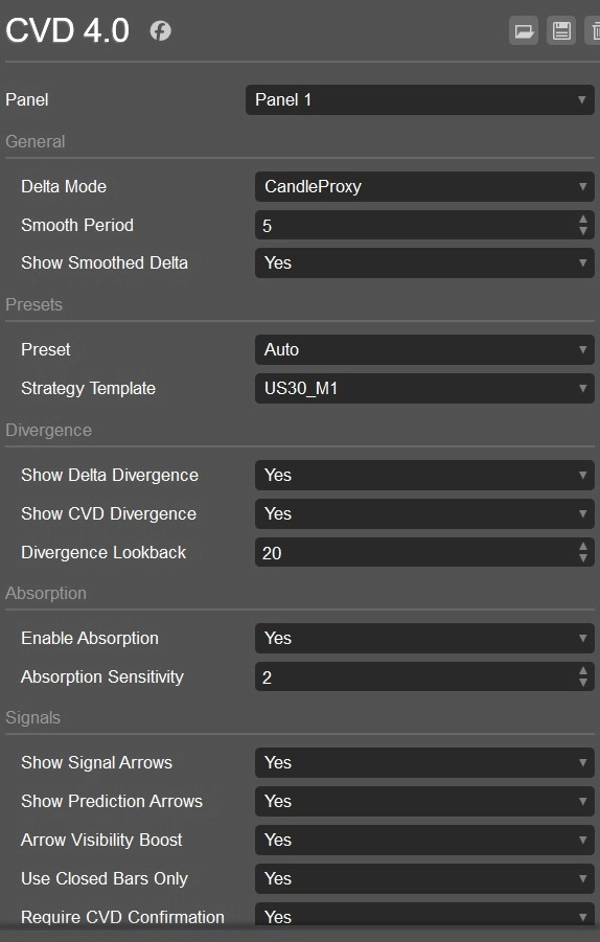
Additional functionalities include detection of bullish and bearish Delta and CVD divergences, absorption detection to identify pressure that fails to move price, and signal arrows for buy/sell opportunities alongside prediction arrows for early momentum shifts. It incorporates session filters for Asia, London, and New York trading sessions, volatility and spread guards, volume ratio filters, and a smart confluence engine with directional scoring.
CVD Ai supports markets such as Forex, Gold, Indices, Crypto, and Oil, and is optimized for scalping, intraday trading, and short-term momentum confirmation on lower timeframes like M1 and M5. It offers strategy templates for specific symbols including US30, USTECH, XAUUSD, BTCUSD, and Oil. The indicator includes an info dashboard displaying bias, Delta, smoothed Delta, CVD, momentum, pressure percentage, and reset mode options.
Recensioni dei clienti
5 | 0 % | |
4 | 100 % | |
3 | 0 % | |
2 | 0 % | |
1 | 0 % |


![Logo di "[Hamster-Coder] Bollinger Bands"](https://cdn.ctrader.com/image/webp/21d8e5d6-fb11-4bac-b9ee-cd05c2b76804_30327)


