
🚀 Más de 10,000 traders ya usan nuestros indicadores TOP 🏆 …¡y la comunidad sigue creciendo!
Descubre por qué los profesionales nos eligen – las herramientas más potentes de cTrader (indicadores + algoritmos + cBots) te están esperando.
👉 Obtén todos nuestros sistemas TOP aquí:
Indicadores de Pinescriptlabs Store: cBots de Pinescriptlabs Store : (cBot) Gold & BTC BreakoutSession Pivots(nuevo)
Proyección de Liquidez de Precio ZigZag
Algoritmo Inteligente de Seguimiento (nuevo)
Mapa de Liquidación de Apalancamiento
Predicción Basada en Linreg & ATR
Soporte y Resistencia SmartTrend
Líneas
Sesiones de Brecha de Valor Justo
Análisis
Dinámico de Estructura
de Mercado
de
Puntos
de Giro
Regresión
Lineal
Fibonacci
Multitemporal
Brecha de Valor Justo de Momentum
Proyección de Flujo de Mercado
Gradiente de Tendencia Dinámico
Rastreador
de Sesgo
de Vela
Multinivel
Rastreador de Extremos Zig-Zag
Soporte
y Resistencia
Automáticos
Líneas de Tendencia
Todos
los Niveles
de Soporte y
Resistencia
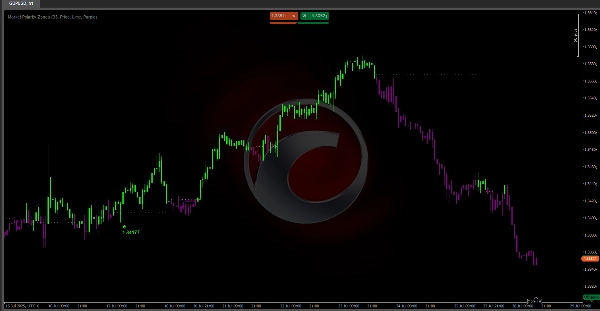
Zonas de Polaridad del Mercado 📊
¿Qué hace este algoritmo?
Zonas de Polaridad del Mercado es un indicador avanzado que simplifica el análisis del mercado identificando automáticamente fases alcistas 🚀 o bajistas 🐻 y marcando niveles clave donde es probable que ocurran reversiones de tendencia.
Ideal para:
- Traders de acción del precio
- Traders de swing
- Scalpers,...que necesitan detectar rápidamente la dirección del mercado y puntos precisos de entrada/salida.
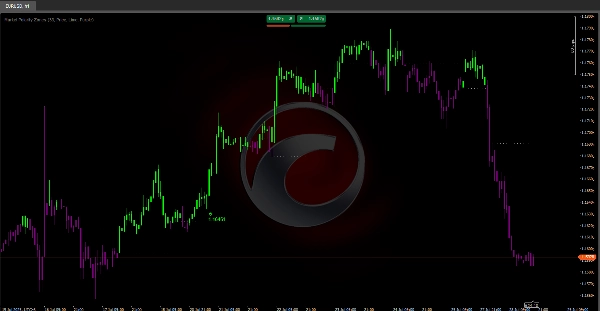
¿Cómo funciona la lógica?
El algoritmo utiliza dos medias móviles Hull (HMA) con diferentes periodos para detectar cambios de momentum y establece niveles dinámicos de la siguiente manera:
- Detecta cruces de HMA para identificar cambios de tendencia.
- Establece niveles automáticos:
-
- Cruce alcista → Marca el mínimo como nivel de soporte
- Cruce bajista → Marca el máximo como nivel de resistencia
- Mantiene el nivel activo hasta que ocurre un nuevo cruce.
Lo que verás en tu gráfico:
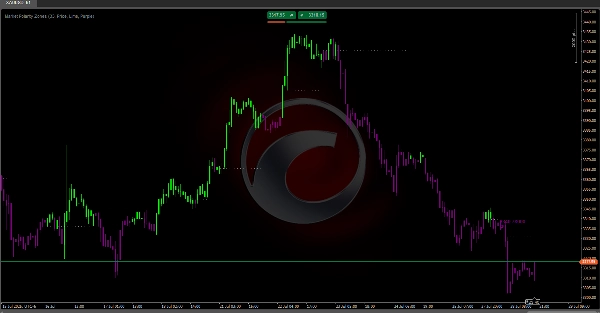
🎨 Sistema de colores intuitivo:
- Velas verdes 🟢: Precio por encima del nivel (zona alcista – busca compras)
- Velas moradas 🟣: Precio por debajo del nivel (zona bajista – busca ventas)
📉 Líneas de nivel dinámicas:
- Líneas horizontales punteadas que marcan el nivel de polaridad activo
- Se extienden automáticamente mientras el nivel sea válido
- Solo aparecen cuando el nivel se estabiliza
⚠️ Alertas de reversión:
Aparecen etiquetas de flecha cuando se forman patrones específicos:
- 🔻 Reversión bajista (etiqueta morada):
-
- Patrón: El precio sube → falla → cae por debajo del nivel
- Significado: Presión alcista debilitándose, posible cambio a zona bajista
- 🔺 Reversión alcista (etiqueta verde):
-
- Patrón: El precio cae → rebota → sube por encima del nivel
- Significado: Compradores defendiendo el nivel, posible cambio a zona alcista
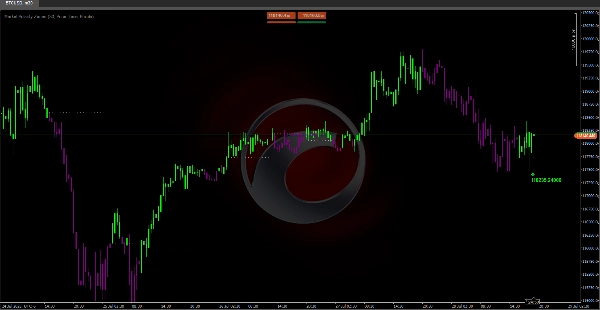
ℹ️ Información de las etiquetas:
- "Precio": Muestra el punto exacto de fallo de ruptura – úsalo para stops precisos o para identificar resistencias/soportes clave.
- "Volumen": Suma del volumen de las últimas 3 barras – confirma si la reversión tiene participación real del mercado.
Configuraciones recomendadas:
- Longitud: 33 (por defecto) – Funciona bien para la mayoría de los mercados
- Datos de etiqueta: "Precio" para precisión de nivel, "Volumen" para confirmación
- Colores: Mantén Lima/Morado para el mejor contraste visual 🎨


![Logotipo de "[CB] Pivot Points Pro"](https://cdn.ctrader.com/image/webp/43463c82-67b0-4f10-a4ba-901bba091d81_32594)


