
Previous day Key Levels
Indicador
411 descargas
Versión 1.0, Oct 2025
Windows, Mac
4.0
Valoraciones: 1
Descripción
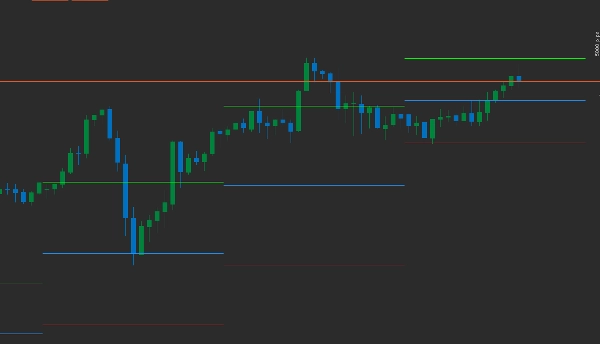
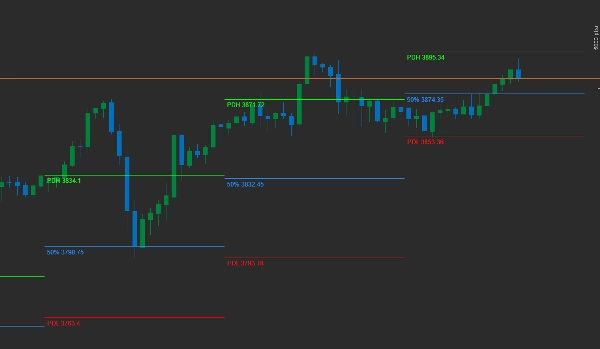
Este indicador traza el máximo, mínimo y retroceso del 50% del día anterior.
El usuario puede activar/desactivar el historial
Con el historial activado, puede seleccionar el número de días a visualizar.
Cambiar los colores de cada línea
Activar/desactivar la etiqueta que identifica cada línea
Resumen
Resumen de IA
The Previous Day Key Levels indicator plots the prior trading day's High, Low, and 50% retracement levels on the chart. Users can customize the display by enabling or disabling historical data and selecting the number of past days to view. The indicator allows color customization for each line and the option to show or hide labels identifying each level. It supports various markets and symbols including Forex pairs (EURUSD, GBPUSD, NZDUSD, USDJPY), cryptocurrencies (BTCUSD, crypto), commodities (XAUUSD, gold, oil, silver), indices (NAS100, Dow, S&P 500, DAX), and stocks. This tool is designed to assist traders in identifying key price levels from the previous day that may influence current market behavior.
Perfil del indicador
Valoraciones de clientes
4.0
Valoraciones: 1
5 | 0 % | |
4 | 100 % | |
3 | 0 % | |
2 | 0 % | |
1 | 0 % |
Valoraciones de clientes
December 1, 2025
Previous Day Key Levels marks yesterday’s High, Low, Open, Close and midpoint - clean, fast and reliable. Great for intraday structure, liquidity zones and reaction points. Lightweight and useful on any timeframe. Alerts and range-zone shading would make it even better.
Conversación
Preguntas frecuentes
BTCUSD
Forex
Breakout
Indices
EURUSD
Commodities
GBPUSD
NZDUSD
Scalping
Crypto
Stocks
XAUUSD
NAS100
USDJPY
Los productos disponibles a través de cTrader Store, incluidos bots, indicadores y plugins para operar, son proporcionados por desarrolladores de terceros y están disponibles únicamente con fines informativos y de acceso técnico. cTrader Store no es un bróker, por lo que no proporciona asesoramiento de inversión, recomendaciones personales ni ninguna garantía de rentabilidad futura.
Más de este autor


Precio
Desde 30/01/2025
36.05M
Volumen operado
26.73K
Pips ganados
1.24K
Instalaciones gratis