
DynamicVolumeSupplyDemand
指标
1.29K 下载
版本 1.0, Apr 2025
Windows 版、Mac 版
4.2
评价:5
说明
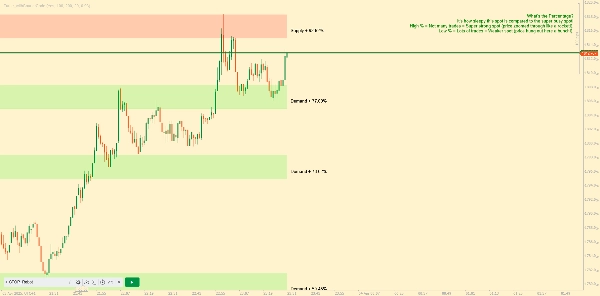
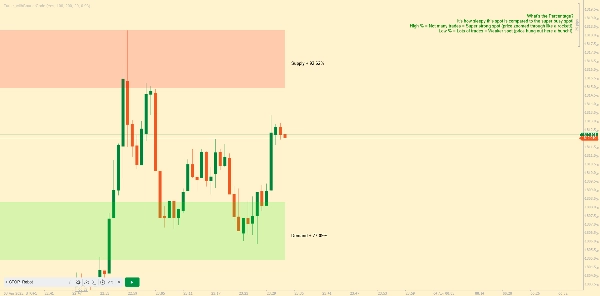
由我为Ctrader平台重新创建的AlgoAlpha动态供需区介绍。该指标旨在自动识别并可视化图表上的动态供需区,帮助交易者精准定位潜在的反转区域,并以更清晰的方式评估市场情绪。它通过动态回溯机制适应市场状况,使其对近期价格变动更为敏感。📈💡
主要特点
- 📊 动态回溯:根据最新的枢轴点自动调整回溯周期,确保分析最相关的数据。
- 🎯 枢轴点检测:利用用户定义的周期检测重要的枢轴高点和低点,精准标记潜在的反转点。
- 🛠 可定制参数:提供广泛的自定义选项,包括回溯周期、枢轴检测灵敏度、分辨率和区域容差。
- 🗺 视觉显示:以框的形式在图表上显示供需区,背景高亮区分多头和空头区域。
- 🖍 颜色编码区域:区域采用颜色编码,便于识别:绿色代表多头,红色代表空头,灰色代表中性水平。
摘要
AI 摘要
DynamicVolumeSupplyDemand is an indicator for the cTrader platform that automatically identifies and visualizes dynamic supply and demand zones on trading charts. It helps traders locate potential reversal areas and evaluate market sentiment by adapting to recent price movements through a dynamic look-back mechanism. Key features include:
- Dynamic Look-Back: Automatically adjusts the look-back period based on the latest pivot points to analyze the most relevant data.
- Pivot Point Detection: Uses a user-defined period to detect significant pivot highs and lows, marking potential reversal points.
- Customizable Parameters: Allows adjustment of look-back period, pivot detection sensitivity, resolution, and zone tolerance.
- Visual Display: Presents supply and demand zones as boxes on the chart with background highlighting to distinguish bullish and bearish zones.
- Color-Coded Zones: Zones are color-coded for clarity—green for bullish, red for bearish, and gray for neutral levels.
This indicator supports enhanced clarity in market analysis by dynamically adapting to changing market conditions and providing clear visual cues for supply and demand levels.
指标配置
客户评价
4.2
评价:5
5 | 40 % | |
4 | 40 % | |
3 | 20 % | |
2 | 0 % | |
1 | 0 % |
客户评价
October 12, 2025
Could you please make a new indicator so too remove the explanation and how the indicator works written on the chart? Very nice indicator otherwise!
August 12, 2025
Pros: Identifies dynamic supply and demand zones based on volume. Flexible settings, strong visual clarity. Cons: No alerts or tooltips. Lacks history of previous zones and user template saving.
May 15, 2025
This indicator finds the supply and demand areas very well but it has a problem. But the explanation and how the indicator works written on the chart is very annoying. I hope the designer of this software will solve this problem. Thank you
讨论
常见问答
cTrader Store 提供的所有产品,包括交易机器人、指标和插件,均由第三方开发者提供,仅供信息参考和技术访问之用。cTrader Store 并非经纪商,不提供投资建议、个人推荐或任何未来业绩保证。


价格
注册日期 09/01/2025
11.78K
免费安装