
Penerangan
Market Regime AI
Pengesanan Keadaan Pasaran Pintar untuk Perdagangan Tepat
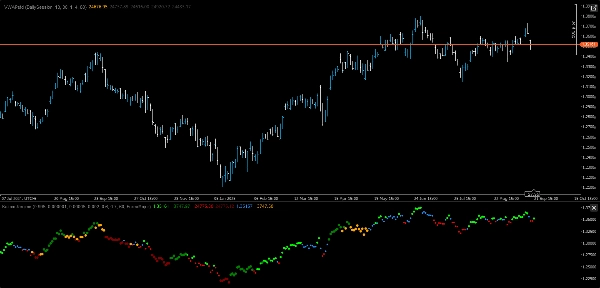
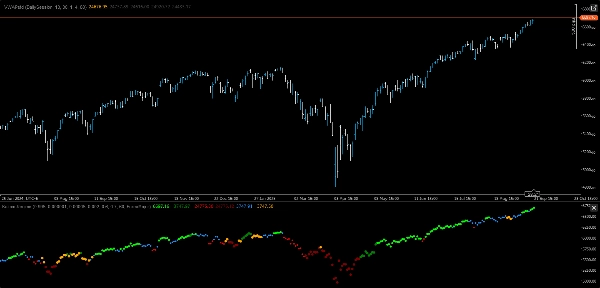
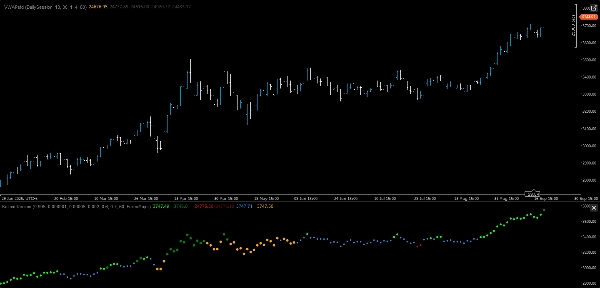
Market Regime AI adalah penunjuk perdagangan canggih yang menggabungkan AI dan matematik dengan logik adaptif untuk mengklasifikasikan pasaran ke dalam salah satu daripada enam rejim yang boleh diambil tindakan secara masa nyata. Dengan memodelkan kedua-dua trend harga dan volatiliti secara serentak, ia memberikan peta berwarna yang jelas mengenai "mood" pasaran semasa — membolehkan pedagang memilih strategi yang tepat dengan segera.
Enam Rejim, Enam Warna, Satu Sistem Pintar
Rejim Warna Mood Pasaran
------------------------ -------------------- -----------------------------------------------
Bull – Volatiliti Rendah Limau Nipis Trend menaik lancar — sesuai untuk mengikuti trend bersaiz penuh
Bull – Volatiliti Tinggi Hijau Trend menaik dengan turbulensi — perdagangan pecahan dengan risiko dikurangkan
Bear – Volatiliti Rendah Merah Trend menurun terkawal — peluang mengikuti trend pendek
Bear – Volatiliti Tinggi Maroon Penurunan tajam — jualan pendek agresif atau lindung nilai pelindung
Sideways – Volatiliti Rendah Biru Dodger Pengukuhan senyap — persediaan pembalikan purata
Sideways – Volatiliti Tinggi Jingga Julat bergelombang — elakkan atau scalping dengan hentian ketat
Ciri-ciri Utama
• Pemodelan AI dua keadaan: Mengesan kedua-dua trend dan volatiliti untuk isyarat yang lebih kaya dan boleh dipercayai.
• Praset aset-sedar: Tetapan dioptimumkan untuk Forex utama, eksotik, emas, dan indeks — bertukar dengan segera melalui dropdown.
• Kejelasan visual: Titik rejim dan bayangan latar belakang pilihan menjadikan keadaan pasaran jelas dengan sekilas pandang.
• Pemetaan strategik: Menghubungkan setiap rejim kepada gaya perdagangan tertentu, saiz posisi, dan kawalan risiko.
• Pengurangan bunyi: Melicinkan data pasaran untuk mendedahkan keadaan sebenar yang mendasari, mengelakkan isyarat palsu.
Mengapa Ia Unik
Kebanyakan penunjuk menumpukan pada satu dimensi sahaja — trend atau volatiliti. Market Regime AI menggabungkan kedua-duanya ke dalam model adaptif yang bersatu, memberikan pedagang pandangan berlapis-lapis mengenai keadaan pasaran. Ini bermakna keputusan dan strategi yang lebih pantas dan pintar yang menyesuaikan diri apabila pasaran berubah.
Senario Penggunaan
• Mengikuti trend: Sertai rejim Bull/Bear–Volatiliti Rendah dengan saiz penuh.
• Perdagangan pecahan: Sasarkan rejim Bull/Bear–Volatiliti Tinggi untuk pergerakan meletup.
• Pembalikan purata: Manfaatkan julat Sideways–Volatiliti Rendah.
• Skala risiko: Kurangkan pendedahan dalam rejim Volatiliti Tinggi untuk melindungi modal.
• Penukaran strategi automatik: Masukkan output rejim ke dalam cBots untuk perdagangan tanpa tangan.
Ringkasan
Ulasan pelanggan
5 | 100 % | |
4 | 0 % | |
3 | 0 % | |
2 | 0 % | |
1 | 0 % |


