
Market Sessions Pre
インジケーター
799 ダウンロード数
バージョン 1.0、Dec 2025
Windows、Mac
4.3
レビュー: 3
説明
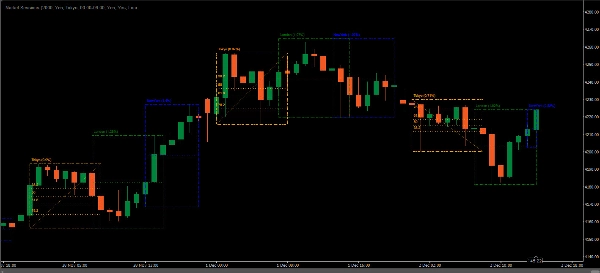
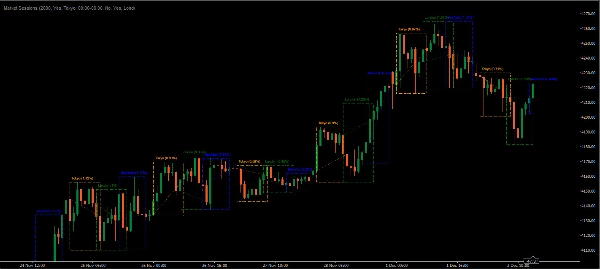
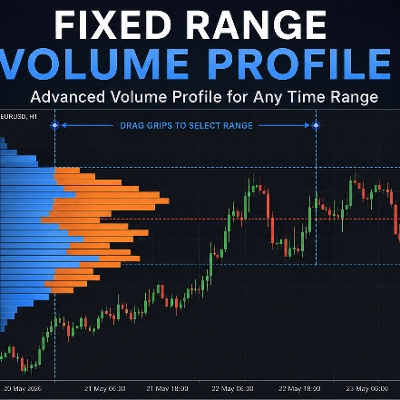
Market Sessionsインジケーターは、価格チャート上で世界の取引セッションを視覚的に表現するために、外国為替および株式トレーダーの間で人気のあるツールです。主要な取引セッションの時間帯—例えば、アジア(東京)、ヨーロッパ(ロンドン)、およびアメリカ(ニューヨーク)のセッション—をチャート上に直接強調表示します。これにより、トレーダーは市場の開閉時間を特定し、セッション固有の取引行動に基づいたより良い意思決定が可能になります。
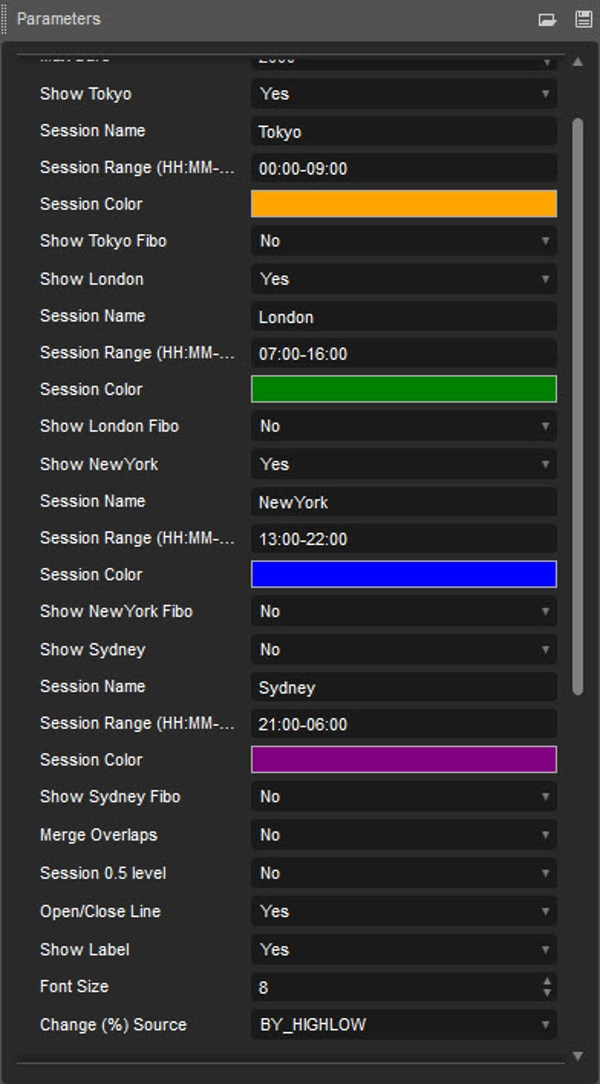
- アジアセッション(デフォルト:00:00-09:00)
- ロンドンセッション(デフォルト:07:00-16:00)
- ニューヨークセッション(デフォルト:13:00-22:00)
- シドニーセッション(デフォルト:21:00-06:00)
Market Sessionsインジケーターの主な特徴
- セッションの時間と重複:
-
- インジケーターは各セッションの開始時間と終了時間を示します。この機能は、各セッションが独自の特徴を持つため役立ちます。例えば、アジアセッションは一般的に穏やかである一方、ロンドンセッションはしばしば高いボラティリティを示します。ロンドンとニューヨークの重複時間も示され、活動が増加する時間帯を示します。
- カスタマイズ可能なセッションカラー:
-
- トレーダーは通常、各セッションの色をカスタマイズできるため、視覚的に区別しやすくなります。このパーソナライズにより明確さが増し、特定のセッションに集中しやすくなります。
- 調整可能なタイムゾーン:
-
- トレーダーは世界中にいるため、インジケーターは通常タイムゾーンの調整を可能にし、セッションの開始・終了時間をトレーダーの現地時間に合わせることができます。これは主要な取引センターと異なるタイムゾーンにいる人に特に有用です。
- セッション固有の戦略:
-
- 各セッションには独特の特徴があります。例えば、ロンドンセッションはしばしば最もボラティリティが高く、ブレイクアウトの機会を提供します。一方、アジアセッションは比較的穏やかで、レンジ取引戦略に適しています。これらの違いを理解することで、トレーダーはセッションの傾向に基づいて戦略を調整できます。
Market Sessionsインジケーターを使う理由
- より良い取引のタイミング:
-
- どのセッションがアクティブかを知ることで、トレーダーは異なるボラティリティや流動性のレベルを活用するために戦略を調整できます。
- 分析と戦略開発の向上:
-
- セッション時間が視覚的に示されることで、トレーダーはセッションごとの価格動向を分析し、それぞれの特徴に最適な戦略を開発・改善できます。
- 市場のボラティリティへの意識向上:
-
- ボラティリティはセッションの開始、終了、および重複時に急増することが多いです。インジケーターはこれらの動きを予測するのに役立ち、突然の市場変動に驚かされる可能性を減らします。
使用例
ボラティリティに関心のあるトレーダーは、ロンドン-ニューヨークの重複期間を狙って市場の大きな動きを活用することがあります。Market Sessionsインジケーターを使用することで、この重複に合わせて取引を計画し、重要な価格変動を捉える可能性を高めることができます。
まとめると、Market Sessionsインジケーターは、時間特有の市場行動に基づいて情報に基づいた意思決定を行いたいトレーダーにとって不可欠なツールです。明確さを提供し、分析を強化し、より効果的な取引戦略を支援します。
概要
AIによる概要
The Market Sessions indicator visually displays major global trading sessions directly on price charts, aiding forex, stock, and crypto traders in identifying active market periods. It highlights the Asian (Tokyo), European (London), American (New York), and Sydney sessions with default time ranges, marking their start and end times as well as overlaps, such as the London-New York overlap known for increased volatility. Traders can customize session colors for clear visual distinction and adjust time zones to align session times with their local time. By showing session-specific market behavior—calmer Asian sessions versus volatile London sessions—the indicator supports tailored trading strategies and improved timing of trades. It enhances analysis by allowing users to observe price action across different sessions and anticipate volatility spikes during session openings, closings, and overlaps. This tool is applicable across multiple markets including forex, cryptocurrencies (e.g., BTCUSD, ETH), indices (e.g., NAS100), and commodities (e.g., XAUUSD). The indicator facilitates informed decision-making based on session dynamics, helping traders optimize entry and exit points according to time-specific market activity.
インジケーターのプロフィール
カスタマーレビュー
4.3
レビュー: 3
5 | 33 % | |
4 | 67 % | |
3 | 0 % | |
2 | 0 % | |
1 | 0 % |
カスタマーレビュー
April 26, 2026
Can you check the indicator code. Unable to edit timeline. As new york and london times vary.
December 10, 2025
Market Sessions Pre highlights Asian, London and NY sessions with clear visual blocks. Perfect for intraday timing and volatility awareness. Lightweight, stable and clean. Great with SMC/ICT concepts. Would benefit from alerts and killzone markers, but already a highly useful tool.
ディスカッション
よくあるご質問
BTCUSD
Forex
Signal
Scalping
EURUSD
Crypto
XAUUSD
NAS100
cTrader Storeで入手可能な取引ボット、インジケーター、プラグインなどの商品は、第三者の開発者が提供するものであり、情報と技術の取得のみを目的としてご利用いただけます。cTrader Storeはブローカーではなく、投資助言や個人的な推奨を行うことも、将来のパフォーマンスを保証することもありません。
この作成者の他の商品


価格
38
販売
2.38K
無料インストール