

Deskripsi
1️⃣ Apa Fungsi Indikator Ini?
Alat ini merangkum arah candle di berbagai timeframe dalam satu tempat di grafik Anda.
Untuk setiap timeframe, alat ini memeriksa candle terakhir yang tertutup dan menampilkan:
StatusMakna
🟢 Bull
Tutup > Buka (pembeli mengendalikan)
🔴 Bear
Tutup < Buka (penjual mengendalikan)
⚪ Doji
Tutup ≈ Buka (ketidakpastian)
Timeframe yang ditampilkan:
- Harian
- H4
- H1
- M30
- M15
- M5
Semua status ditampilkan langsung di grafik, jadi Anda tidak perlu mengganti timeframe.
2️⃣ Mengapa Alat Ini Kuat
🔥 Memecahkan Masalah Umum Trader
Kebanyakan trader bertanya:
“Apakah saya trading sejalan atau melawan tren timeframe yang lebih tinggi?”
Indikator ini menjawab itu secara instan.
Daripada menebak:
- Anda melihat keselarasan tren
- Anda menghindari entri melawan tren
- Anda meningkatkan waktu & kepercayaan diri
3️⃣ Cara Kerja Indikator
📌 Logika Status Candle
- Menggunakan candle terakhir yang tertutup (
Last(1)) - Tidak ada repainting
- Konfirmasi yang dapat diandalkan
📌 Data Multi-Timeframe
- Mengambil data candle nyata dari setiap timeframe
- Bebas dari timeframe grafik yang sedang Anda gunakan
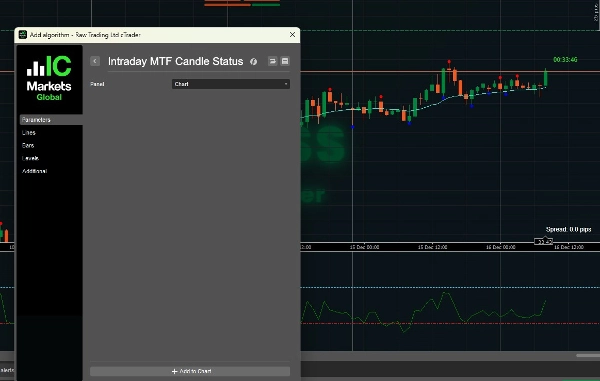
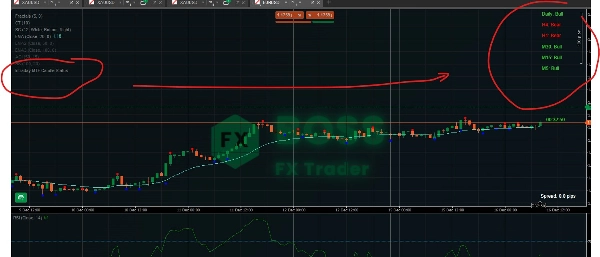
📌 Tampilan di Grafik
- Menggambar label teks di area kanan atas
- Berwarna untuk kemudahan baca instan
- Diperbarui setiap tick
4️⃣ Cara Menggunakannya Secara Efektif (Skenario Trading)
🟢 Skenario 1: Konfirmasi Tren (Kasus Penggunaan Terbaik)
✔ Aturan:
Trading hanya saat timeframe lebih tinggi dan lebih rendah setuju
Contoh:
Harian: Bull
H4: Bull
H1: Bull
M15: Bull
M5: Bull
✅ Lingkungan BELI dengan probabilitas tinggi
Gunakan:
- Pullback
- Breakout
- Entri kelanjutan
❌ Hindari JUAL di sini
🔴 Skenario 2: Peringatan Melawan Tren
Harian: Bull
H4: Bull
H1: Bear
M15: Bear
M5: Bear
⚠️ Pasar sedang dalam pullback, bukan pembalikan.
Tindakan terbaik:
- Tunggu M5/M15 kembali menjadi Bull
- Hindari mengejar JUAL
- Cari setup beli di support
⚪ Skenario 3: Pasar Berombak / Sideways
Harian: Bull
H4: Doji
H1: Doji
M15: Bear
M5: Bull
🚫 Kondisi kualitas rendah
Disarankan:
- Kurangi ukuran posisi
- Hindari trading breakout
- Tunggu kejelasan struktur
5️⃣ Contoh Strategi Scalping (Entri M5)
🔹 Setup Beli Ideal
- Harian → Bull
- H4 → Bull
- H1 → Bull
- M15 → Bull
- M5 → Bear → berubah menjadi Bull
📍 Entri:
- Saat M5 berbalik kembali ke Bull
- Gabungkan dengan:
-
- Support
- Fraktal
- EMA / VWAP
🔹 Setup Jual Ideal
Logika sebaliknya:
- TF lebih tinggi → Bear
- Masuk saat pullback M5 selesai
6️⃣ Kombinasi Timeframe Terbaik
Gaya TradingFokus Timeframe
Scalping
H1 → M15 → M5
Intraday
H4 → H1 → M15
Swing
Harian → H4 → H1
7️⃣ Apa yang BUKAN Alat Ini
🚫 Bukan sinyal entri sendiri
🚫 Bukan indikator pembalikan
🚫 Bukan pengganti struktur / aksi harga
✅ Ini adalah alat bias & konfirmasi
8️⃣ Indikator Terbaik untuk Digabungkan
Pasangan yang sangat direkomendasikan:
- ✅ Fraktal (Anda sudah menggunakannya)
- ✅ Struktur pasar (HH / LL)
- ✅ Support & Resistance
- ✅ EMA 50 / EMA 200
- ✅ VWAP
9️⃣ Aturan Trading Profesional Menggunakan Alat Ini
✔ Trading hanya sesuai arah HTF
✔ Gunakan LTF hanya untuk waktu entri
✔ Abaikan sinyal saat Harian & H4 tidak setuju
✔ Jangan overtrade saat sinyal campuran
✔ Biarkan struktur mengonfirmasi bias candle
🔟 Ringkasan Akhir
IntradyMultiTimeframeCandleStatus = Dashboard Bias Pasar
Ini memberi Anda:
- Kejelasan tren instan
- Trading dengan probabilitas lebih tinggi
- Keputusan yang kurang emosional
- Eksekusi yang lebih bersih
Lihat produk kami.
Ringkasan
Ulasan pelanggan
5 | 100 % | |
4 | 0 % | |
3 | 0 % | |
2 | 0 % | |
1 | 0 % |


![Logo "[Hamster-Coder] Bollinger Bands"](https://cdn.ctrader.com/image/webp/21d8e5d6-fb11-4bac-b9ee-cd05c2b76804_30327)


