
Deskripsi
CVD ai
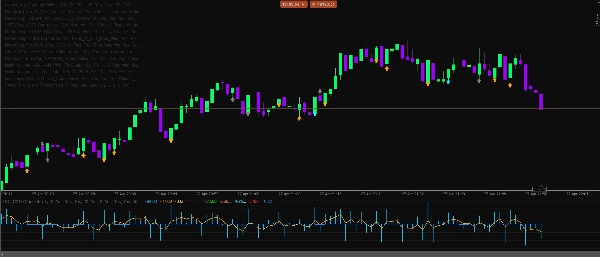
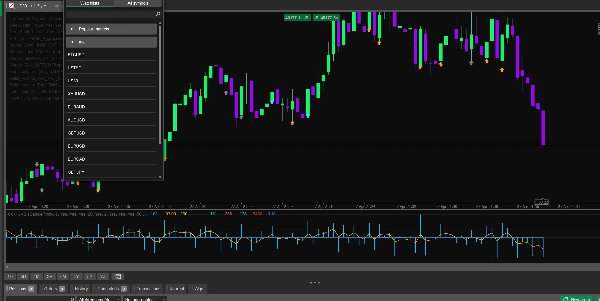
Delta CVD Advanced adalah indikator analisis momentum dan order profesional yang dirancang untuk trader yang menginginkan pandangan yang lebih jelas tentang tekanan beli dan jual langsung dari perilaku pasar. Ini menggabungkan Delta, CVD, momentum tick langsung, absorpsi, divergensi, filter sesi, pengaman volatilitas, dan mesin konfluensi cerdas menjadi satu alat analisis yang bersih.
Indikator ini dibuat untuk scalping, trading intraday, dan konfirmasi momentum jangka pendek di pasar Forex, Emas, Indeks, Kripto, dan Minyak.
Fitur Utama
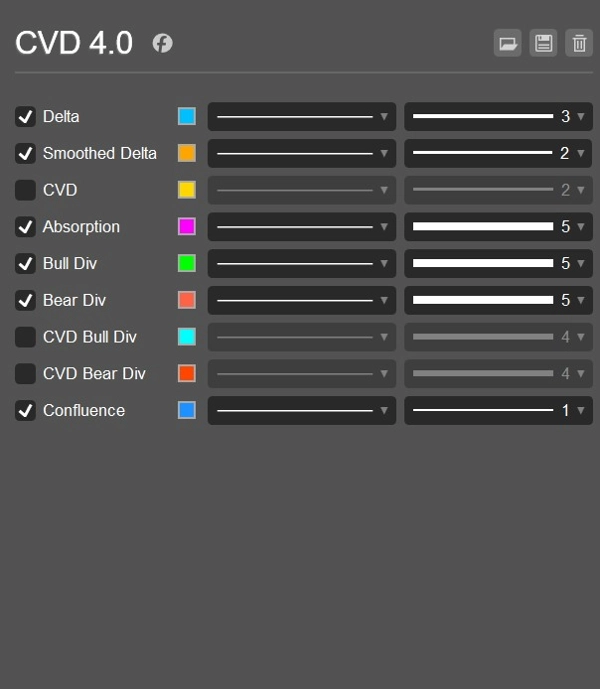
- Perhitungan Delta langsung menggunakan logika uptick/downtick
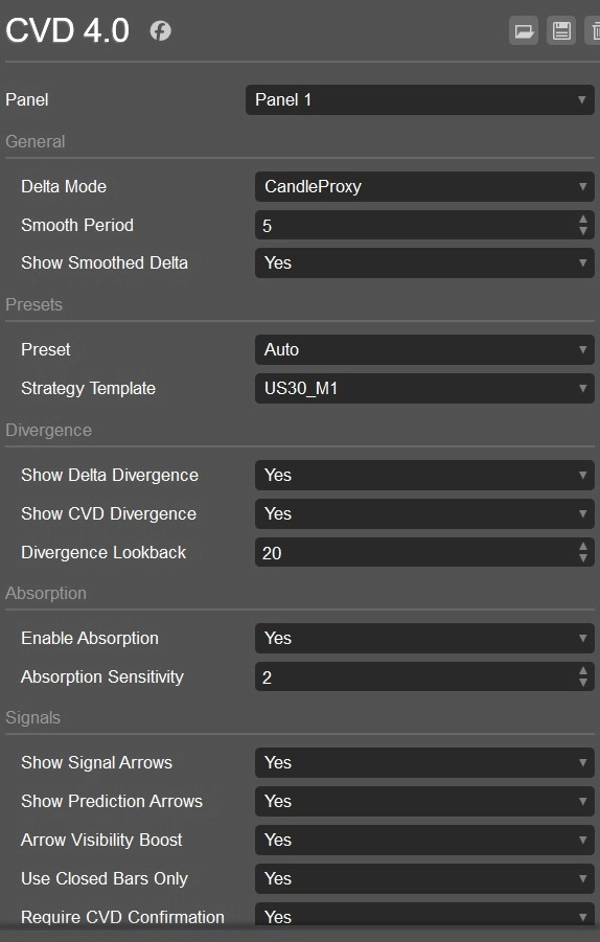
- Mode delta proxy candle untuk analisis historis
- Garis Cumulative Volume Delta untuk melacak tekanan dari waktu ke waktu
- Garis Delta yang dihaluskan untuk pembacaan momentum yang lebih bersih
- Histogram Delta berwarna Beli/Jual
- Perhitungan momentum berbasis tick untuk impuls pasar langsung
- Mode momentum hibrida yang menggabungkan kemiringan CVD dan impuls tick
- Opsi reset CVD: Tidak Pernah, Harian, atau berdasarkan Sesi
- Deteksi divergensi Delta bullish dan bearish
- Deteksi divergensi CVD bullish dan bearish
- Deteksi absorpsi untuk mengidentifikasi tekanan yang gagal menggerakkan harga
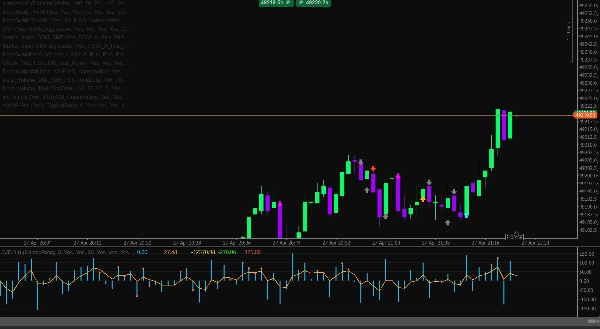
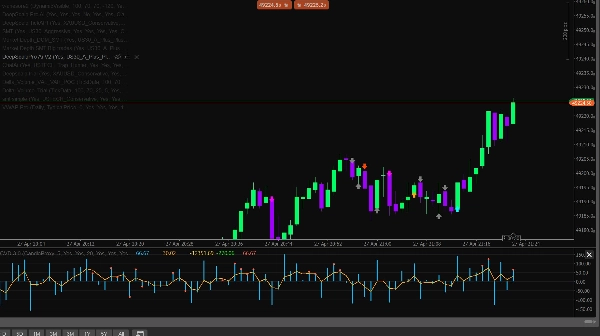
- Panah sinyal untuk peluang BELI dan JUAL
- Panah prediksi untuk peringatan pergeseran momentum awal
- Konfirmasi CVD opsional untuk sinyal
- Mesin konfluensi cerdas dengan skor arah
- Filter tekanan proxy DOM
- Filter deteksi sweep untuk pengambilan likuiditas
- Filter sesi untuk Asia, London, dan New York
- Deteksi sesi otomatis menggunakan waktu UTC
- Pengaman volatilitas menggunakan batas ATR
- Pengaman spread untuk menghindari kondisi pasar yang buruk
- Filter rasio volume untuk menghindari sinyal lemah dengan volume rendah
- Preset simbol untuk Forex, Emas, Indeks, Kripto, dan Minyak
- Template strategi untuk US30 M1, USTECH M1, XAUUSD M1, BTCUSD M1, dan Minyak M1
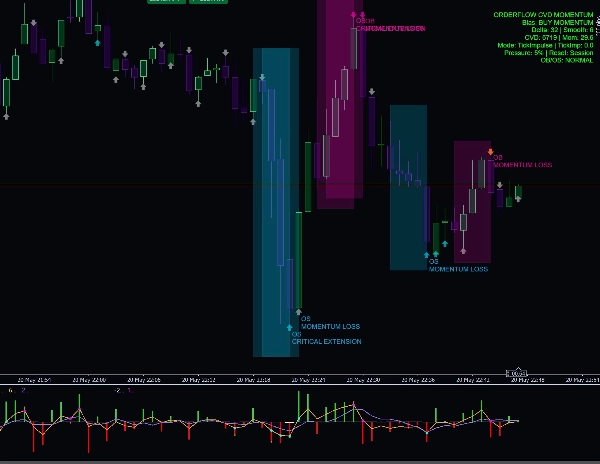
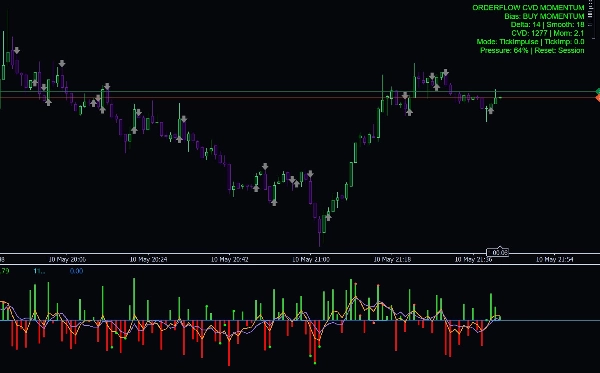
- Dashboard info yang menampilkan bias, Delta, Delta yang dihaluskan, CVD, Momentum, persentase tekanan, dan mode reset
- Peringatan log opsional dengan kontrol cooldown
Mengapa Trader Menggunakannya
Delta CVD Advanced membantu trader memahami siapa yang saat ini mengendalikan: pembeli atau penjual. Alih-alih hanya mengandalkan candle harga, indikator ini menganalisis tekanan di balik pergerakan. Ini membuatnya berguna untuk mengonfirmasi entri, menghindari sinyal lemah, mengidentifikasi pembalikan, mendeteksi absorpsi, dan mendeteksi pergeseran momentum sebelum menjadi jelas pada harga.
Mode momentum tick sangat berguna untuk scalping langsung karena bereaksi terhadap impuls harga waktu nyata, sementara alat CVD dan delta yang dihaluskan membantu mengonfirmasi apakah pergerakan tersebut memiliki kekuatan nyata di baliknya.
Penggunaan Terbaik Untuk
- Scalping
- Trading intraday
- Konfirmasi momentum
- Konfirmasi pembalikan
- Analisis sweep likuiditas
- Trading divergensi Delta dan CVD
- Pasangan Emas, Indeks, Kripto, Minyak, dan Forex
- M1, M5, dan timeframe rendah lainnya
Pemberitahuan Penting
Indikator ini adalah alat pendukung keputusan analitis. Ini tidak menjamin keuntungan dan harus digunakan bersama dengan manajemen risiko yang tepat, struktur pasar, dan rencana trading yang telah diuji.
Ringkasan
Additional functionalities include detection of bullish and bearish Delta and CVD divergences, absorption detection to identify pressure that fails to move price, and signal arrows for buy/sell opportunities alongside prediction arrows for early momentum shifts. It incorporates session filters for Asia, London, and New York trading sessions, volatility and spread guards, volume ratio filters, and a smart confluence engine with directional scoring.
CVD Ai supports markets such as Forex, Gold, Indices, Crypto, and Oil, and is optimized for scalping, intraday trading, and short-term momentum confirmation on lower timeframes like M1 and M5. It offers strategy templates for specific symbols including US30, USTECH, XAUUSD, BTCUSD, and Oil. The indicator includes an info dashboard displaying bias, Delta, smoothed Delta, CVD, momentum, pressure percentage, and reset mode options.
Ulasan pelanggan
5 | 0 % | |
4 | 100 % | |
3 | 0 % | |
2 | 0 % | |
1 | 0 % |


