
الوصف
كيفية التداول باستخدام استراتيجية دونشيان (الاختراق)
- اشترِ عندما يكسر السعر أعلى سعر لفترة N (الأعلى).
- بيع عندما يكسر السعر أدنى سعر لفترة N (الأدنى).
- احتفظ بالمركز طالما استمر الاتجاه؛ اخرج عند اختراق معاكس أو عبر وقف متحرك.
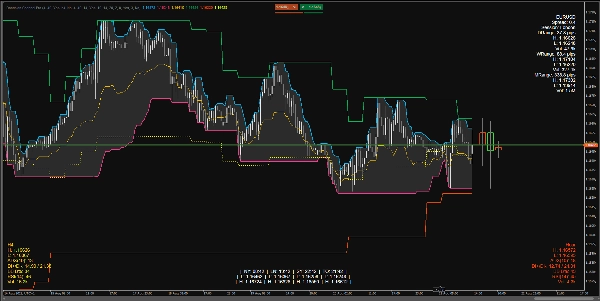
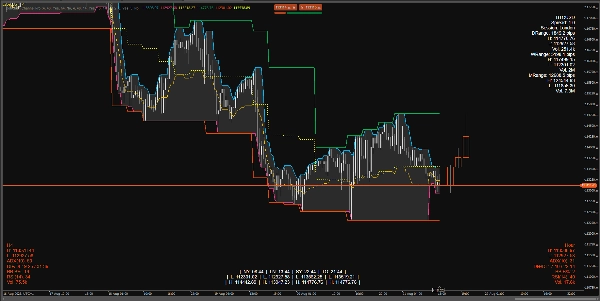
ما الذي يظهره المؤشر على الرسم البياني
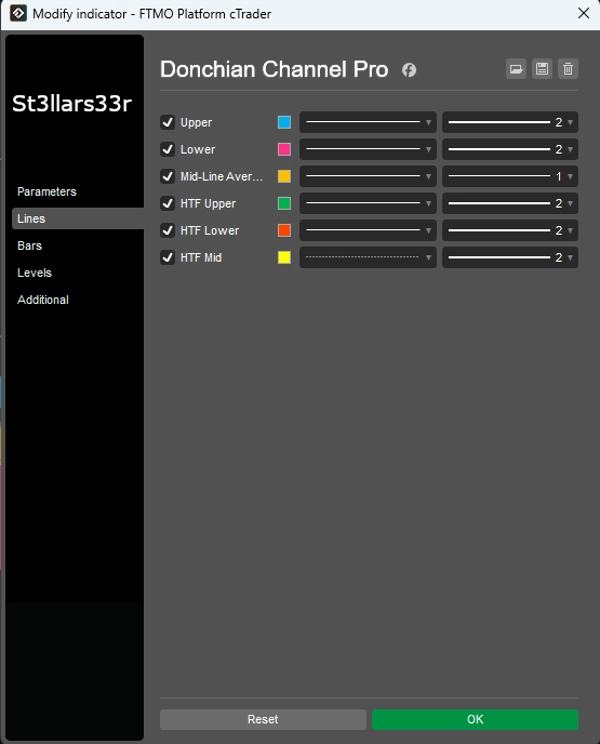
دونشيان على الإطار الزمني الحالي (TF):
- الأعلى: أعلى سعر خلال أشرطة القناة العليا.
- الأدنى: أدنى سعر خلال أشرطة القناة السفلى.
- الوسط: نقطة المنتصف بين الأعلى والأدنى.
تراكب الإطار الزمني الأعلى: خطوط دونشيان من إطار زمني أعلى مغطاة على الرسم البياني:
- HTF الأعلى، HTF الأدنى، HTF الوسط
- HTF شموع HUD: مستطيلات تمثل شموع الإطار الزمني الأعلى، مثبتة على يمين الشمعة الأخيرة في الإطار الزمني الحالي.
شاشات العرض (HUDs) في الأسفل/الأعلى:
- أعلى اليمين: لوحة معلومات للرمز + نطاقات يومية/أسبوعية/شهرية.
- أسفل اليسار: شاشة HUD للإطار الزمني الأعلى (مقاييس للإطار الزمني الأعلى).
- أسفل اليمين: شاشة HUD للإطار الزمني المتوسط (مقاييس للإطار الزمني المتوسط).
- أسفل الوسط: ساعات الجلسة + أعلى/أدنى لكل جلسة (دائم).
ما يعرضه كل HUD
أعلى اليمين (الزاوية العليا اليمنى)
- اسم الرمز
- الفارق: الفارق بالنقاط.
- الجلسة: الجلسة النشطة الحالية (استنادًا إلى الساعات المحددة).
- نطاق يومي/أسبوعي/شهري: النطاق اليومي/الأسبوعي/الشهري بالنقاط.
- أعلى/أدنى/الحجم: أعلى/أدنى والحجم الكلي للفترة المعنية.
أسفل اليسار (الزاوية السفلى اليسرى) — شاشة HUD للإطار الزمني الأعلى
- اسم الإطار الزمني (مثل H4، D1، إلخ.)
- أعلى/أدنى: أعلى/أدنى الحالي للشمعة الأخيرة (أو النشطة) في الإطار الزمني الأعلى.
- ADX(n)، DI+/DI-: مؤشرات الاتجاه.
- BB B%: موقع السعر الحالي بالنسبة لأشرطة بولينجر في الإطار الزمني الأعلى (0 قرب الشريط السفلي، 100 قرب الشريط العلوي).
- RSI(n)
- الحجم: الحجم في الإطار الزمني الأعلى.
- لون HUD:
-
- أخضر: اتساع النطاق صعودًا (ارتفاع DI+ وADX).
- أحمر: زيادة الضغط نزولًا (ارتفاع DI-).
- أصفر: محايد/غير محدد.
أسفل اليمين (الزاوية السفلى اليمنى) — شاشة HUD للإطار الزمني المتوسط
- نفس شاشة HUD للإطار الزمني الأعلى، ولكن للإطار الزمني المتوسط.
أسفل الوسط (الوسط السفلي) — الساعات + أعلى/أدنى الجلسة
- الوقت في نيويورك، لندن، سيدني، طوكيو.
- أدنى/أعلى لكل جلسة.
- المنطق الدائم: عندما تكون الجلسة غير نشطة، يعرض أعلى/أدنى الجلسة المكتملة الأخيرة؛ عند بدء جلسة جديدة، يتم إعادة تعيين القيم وإعادة الحساب.
المعلمات وكيفية استخدامها
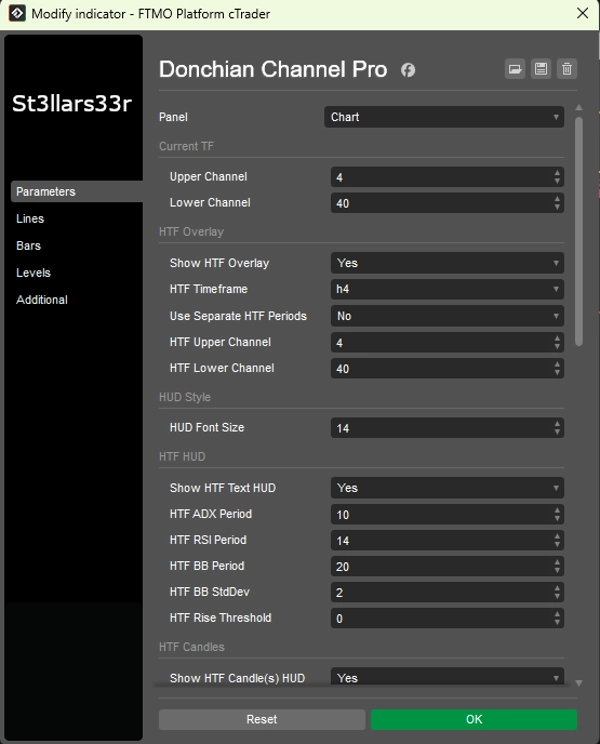
المجموعة: الإطار الزمني الحالي (دونشيان الحالي)
- القناة العليا: عدد الأشرطة للقناة العليا. قيمة أكبر = تحديثات أقل تواترًا، خط أكثر استواءً.
- القناة السفلى: عدد الأشرطة للقناة السفلى.
المجموعة: تراكب الإطار الزمني الأعلى (تراكب دونشيان للإطار الزمني الأعلى)
- عرض تراكب HTF: يفعّل خطوط HTF على الرسم البياني.
- الإطار الزمني HTF: اختر إطارًا زمنيًا أعلى (مثل Hour4).
- استخدام فترات HTF منفصلة: إذا كانت صحيحة، يستخدم HTF الأعلى/الأدنى معلماته الخاصة؛ إذا كانت خاطئة، يستخدم الأعلى/الأدنى الحالي.
- قناة HTF العليا: طول القناة العليا لـ HTF.
- قناة HTF السفلى: طول القناة السفلى لـ HTF.
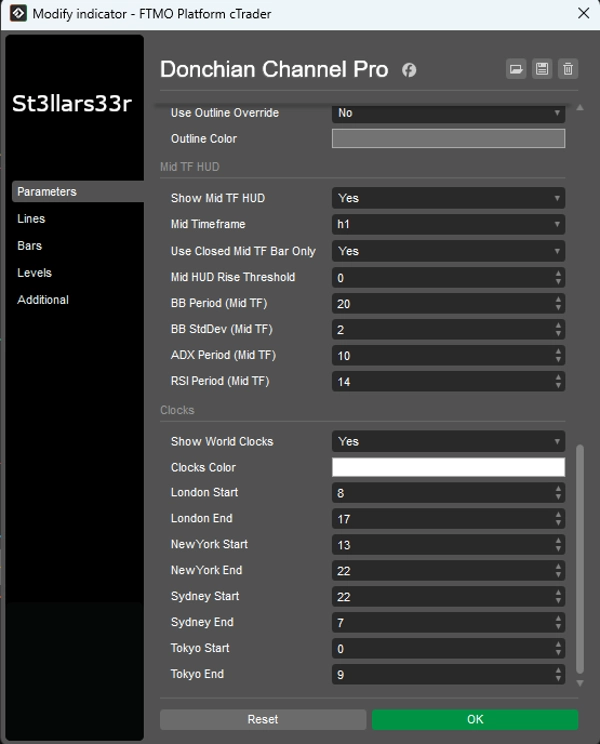
المجموعة: نمط HUD
- حجم خط HUD: حجم الخط لجميع شاشات HUD (أعلى اليمين، أسفل اليسار، أسفل اليمين، أسفل الوسط).
المجموعة: شاشة HUD للإطار الزمني الأعلى (أسفل اليسار)
- عرض نص HUD للإطار الزمني الأعلى: عرض نص HUD لـ HTF.
- فترة ADX للإطار الزمني الأعلى: فترة ADX/DI. قيمة أكبر = أكثر سلاسة، ضوضاء أقل، لكن استجابة أبطأ.
- فترة RSI للإطار الزمني الأعلى: فترة RSI.
- فترة BB للإطار الزمني الأعلى: فترة أشرطة بولينجر.
- انحراف معياري BB للإطار الزمني الأعلى: مضاعف الانحراف المعياري لأشرطة بولينجر (الكلاسيكي 2.0).
- عتبة ارتفاع HTF: الحساسية للمعايير الصاعدة (تؤثر على لون HUD).
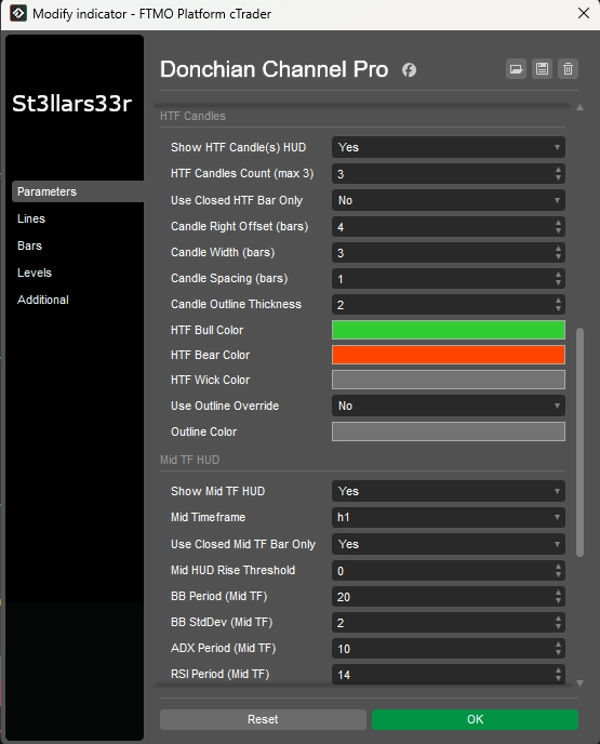
المجموعة: شموع HTF (يمين، قرب الشمعة الأخيرة)
- عرض شموع HTF HUD: عرض شموع HTF على اليمين.
- عدد شموع HTF (حد أقصى 3): عدد شموع HTF (1–3).
- استخدام شريط HTF المغلق فقط: إذا كانت صحيحة، يستخدم فقط شموع HTF المغلقة (قيم مستقرة). إذا كانت خاطئة، يشمل الشمعة المفتوحة الحالية.
- إزاحة الشمعة إلى اليمين (أشرطة): الإزاحة إلى اليمين بالأشرطة من الإطار الزمني الحالي من الشمعة الأخيرة (المرساة).
- عرض الشمعة (أشرطة): عرض مستطيل الشمعة بأشرطة الإطار الزمني الحالي.
- تباعد الشموع (أشرطة): الفجوة بين الشموع.
- سمك حدود الشمعة: سمك حدود الشموع.
- لون شمعة الثور HTF / لون شمعة الدب HTF: ألوان الشموع الصاعدة/الهابطة.
- لون الفتيل HTF: لون الفتائل.
- استخدام تجاوز الحدود: إذا كانت صحيحة، يتم رسم جسم الشمعة مع حدود (لون الحدود) بدون تعبئة صعود/هبوط.
- لون الحدود: لون الحدود عند استخدام تجاوز الحدود = صحيح.
المجموعة: شاشة HUD للإطار الزمني المتوسط (أسفل اليمين)
- عرض شاشة HUD للإطار الزمني المتوسط: يفعّل شاشة HUD للإطار الزمني المتوسط.
- الإطار الزمني المتوسط: اختر الإطار الزمني المتوسط (مثل Minute15).
- استخدام شريط الإطار الزمني المتوسط المغلق فقط: نفس HTF، ولكن للإطار الزمني المتوسط.
- عتبة ارتفاع شاشة HUD للإطار الزمني المتوسط: حساسية اللون لشاشة HUD للإطار الزمني المتوسط.
- فترة BB (الإطار الزمني المتوسط)، انحراف معياري BB (الإطار الزمني المتوسط): إعدادات أشرطة بولينجر للإطار الزمني المتوسط.
- فترة ADX (الإطار الزمني المتوسط)، فترة RSI (الإطار الزمني المتوسط): فترات ADX وRSI للإطار الزمني المتوسط.
المجموعة: الساعات (الوسط السفلي)
- عرض ساعات العالم: عرض كتلة تحتوي على الساعات وأعلى/أدنى الجلسة.
- لون الساعات: لون النص للساعات/الجلسات.
- بداية لندن / نهاية لندن: ساعات بداية/نهاية جلسة لندن.
- بداية نيويورك / نهاية نيويورك: لجلسة نيويورك.
- بداية سيدني / نهاية سيدني: لجلسة سيدني.
- بداية طوكيو / نهاية طوكيو: لجلسة طوكيو.
الساعات: عرض الوقت المحلي الحقيقي للمدن (عبر مناطق زمنية لنظام التشغيل مع تعويض احتياطي).
- حسابات نشاط الجلسة (وأعلى/أدنى) تستخدم وقت خادم الوسيط (Server.Time). إذا لم يكن الخادم على UTC، قد تتحرك ساعات الجلسة—قم بضبط البداية/النهاية حسب الحاجة لخادمك.
- إذا عبرت الجلسة منتصف الليل (النهاية < البداية)، يأخذ المؤشر في الاعتبار تلقائيًا انتقال التاريخ.
- عندما تكون الجلسة غير نشطة، يعرض أعلى/أدنى الجلسة المكتملة الأخيرة؛ عند بدء جلسة جديدة، يتم إعادة تعيين البيانات وإعادة الحساب.
الملخص
تقييمات العملاء
5 | 50 % | |
4 | 50 % | |
3 | 0 % | |
2 | 0 % | |
1 | 0 % |


