
TrendStrengthSignals
Indikator
Versi 1.0, Aug 2025
Windows, Mac
5.0
Ulasan: 1
Sejak 26/05/2025
385.09M
Volum yang didagangkan
60.66K
Pip dimenangi
14
Jualan
1.4K
Pemasangan percuma
Penerangan
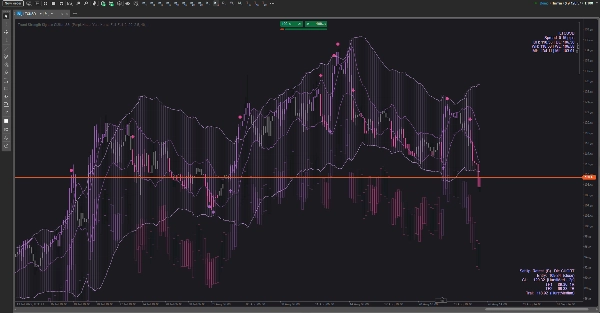
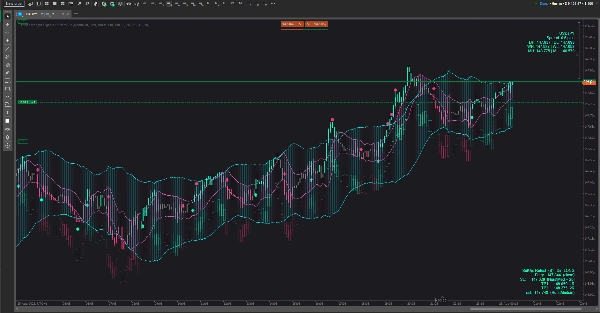
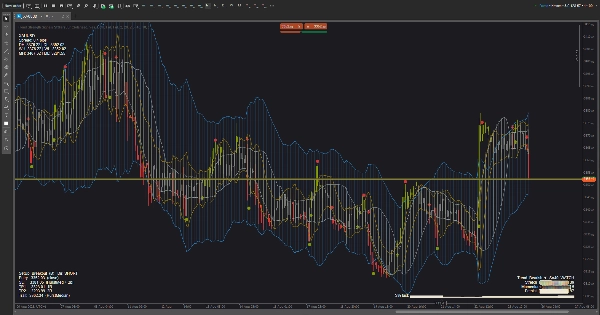
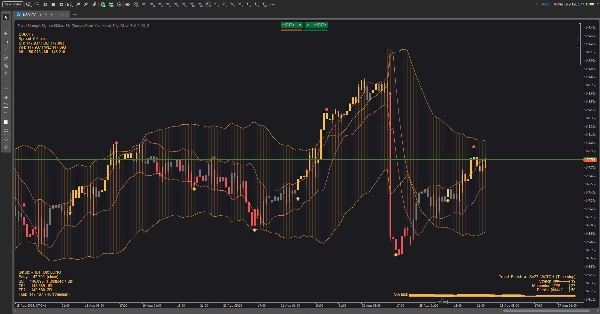
Satu set alat visual untuk perdagangan tren yang menggabungkan amplop volatiliti dengan saluran yang peka kitaran untuk menunjukkan rejim, masa, dan risiko dengan sekilas pandang. Ia direka untuk dibaca pada latar belakang apa pun (terang/gelap) dan untuk memastikan skrin bersih sambil masih memberikan petunjuk “apa yang perlu dilakukan seterusnya”.
Apa yang anda lihat pada carta
- Awan (boleh dihidupkan/dimatikan):
-
- Satu awan volatiliti yang mengembang/menguncup dengan aktiviti pasaran.
- Satu awan kitaran yang mengesan irama bergulung harga.
- Anda boleh menunjukkan salah satu, kedua-duanya, atau tiada.
- Isyarat: anak panah naik/turun yang tidak mengganggu untuk potensi perubahan tren; titik kecil untuk dorongan ambil untung.
- Paparan Kekuatan Tren (tiga gaya):
-
- Ringan — tag status padat.
- Pro — papan pemuka kecil dengan tiga meter (regangan, momentum, ketekunan) serta mini sparkline sejarah.
- Pita — bar lembut berhampiran harga yang intensitinya mengikuti kekuatan tren.
- Paparan Risiko: mencadangkan arah, kawasan hentian perlindungan, dua sasaran keuntungan berlapis, dan idea trailing pilihan. Ia diletakkan di mana-mana sudut yang anda pilih dan dikemas kini apabila bar berkembang.
- Paparan Pasaran: simbol & spread, serta rujukan tinggi–rendah hari/minggu/bulan, supaya anda sentiasa tahu di mana anda berada dalam peta yang lebih besar.
- Tema: set warna yang dikurasi untuk carta terang dan gelap (dan mod Custom). Semua elemen grafik—termasuk Paparan dan isyarat—mengikuti tema aktif.
Cara menggunakannya (praktikal, bukan teknikal)
- Pilih pandangan awan anda:
-
- Gunakan awan volatiliti untuk melihat pengecutan dan pengembangan.
- Gunakan awan kitaran untuk menilai putaran “tepi” vs “tengah”.
- Gunakan kedua-duanya jika anda mahukan konteks + masa.
- Baca Kekuatan Tren:
-
- Apabila status meningkat ke HOLD, biasakan perdagangan dengan arah semasa; apabila turun ke WATCH, kurangkan agresif; jika menunjukkan EXIT, elakkan perdagangan baru atau ketatkan risiko.
- Dalam mod Pro, meter yang meningkat + sparkline yang meningkat = kualiti bertambah baik; meter yang pudar = urus risiko ke bawah.
- Masa kemasukan dengan harga vs awan:
-
- Pecahan selepas pemampatan, kemasukan semula selepas penarikan balik sopan ke awan, atau pantulan dari tepi luar adalah corak utama.
- Jika anak panah awal muncul di tengah bar dan kemudian hilang, tunggu pengesahan penutupan bar jika anda lebih suka kurang helah palsu.
- Urus perdagangan dengan Paparan Risiko:
-
- Letakkan hentian perlindungan kira-kira di luar sempadan struktur terdekat yang ditunjukkan oleh Paparan.
- Skala keluar di TP1, biarkan selebihnya sasarkan TP2 atau ikut garis trailing yang dicadangkan.
- Jika Kekuatan Tren merosot dari kuat ke lemah, pertimbangkan keluar lebih awal.
- Penapis situasi:
-
- Elakkan kemasukan apabila awan nipis dan bergelombang, atau apabila status kekuatan berada di EXIT.
- Utamakan perdagangan apabila kekuatan meningkat, awan condong, dan harga berinteraksi dengan jelas dengan tepi.
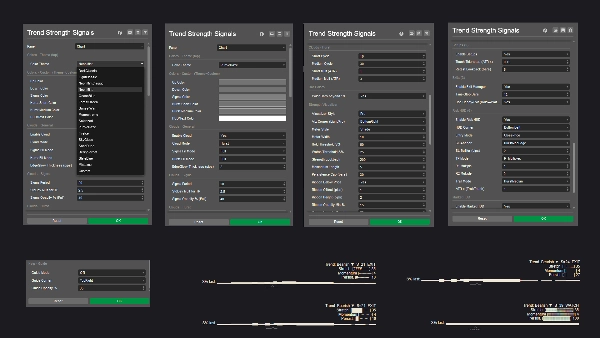
Penyesuaian
- Tukar sudut Paparan, gaya visualisasi, dan tema warna untuk disesuaikan dengan ruang kerja anda.
- Tema mesra cahaya memastikan teks kelihatan pada latar belakang putih; palet lautan/hutan/sunset menambah kontras halus tanpa silau.
Apa yang bukan
Ini bukan autotrader kotak hitam. Ia adalah alat bantu keputusan: ia membingkai kualiti tren, mencadangkan lokasi risiko yang munasabah, dan menyerlahkan momen kebarangkalian tinggi—tetapi anda kekal mengawal.
Ringkasan
Profil indikator
Ulasan pelanggan
5.0
Ulasan: 1
5 | 100 % | |
4 | 0 % | |
3 | 0 % | |
2 | 0 % | |
1 | 0 % |
Ulasan pelanggan
September 2, 2025
The reason it feels usable is direction is easier to respect, and a 1R exit plan makes review easier.
Perbincangan
Soalan Lazim
Produk yang tersedia melalui cTrader Store, termasuk bot dagangan, indikator dan plugin, disediakan oleh pembangun pihak ketiga dan diberikan akses untuk tujuan maklumat dan teknikal sahaja. cTrader Store bukan broker dan tidak memberikan nasihat pelaburan, syor peribadi atau sebarang jaminan prestasi masa hadapan.


Harga
Sejak 26/05/2025
385.09M
Volum yang didagangkan
60.66K
Pip dimenangi
14
Jualan
1.4K
Pemasangan percuma