
VolumeThermometer
Indikator
426 muat turun
Versi 1.0, Aug 2025
Windows, Mac
Sejak 26/05/2025
451.48M
Volum yang didagangkan
61.16K
Pip dimenangi
15
Jualan
1.43K
Pemasangan percuma
Penerangan
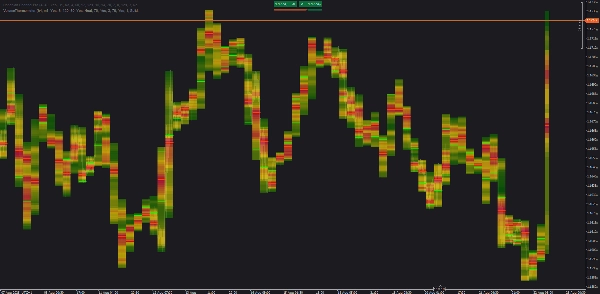
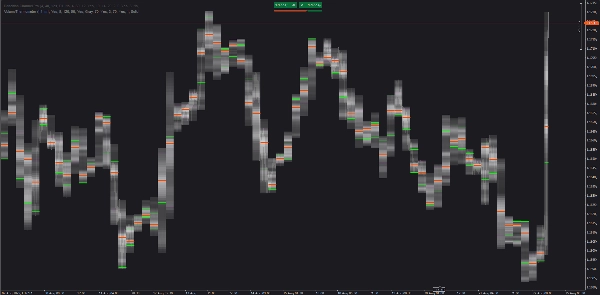
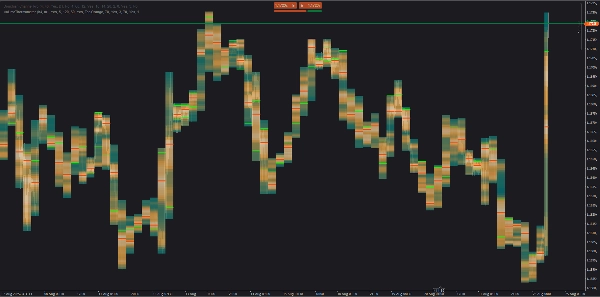
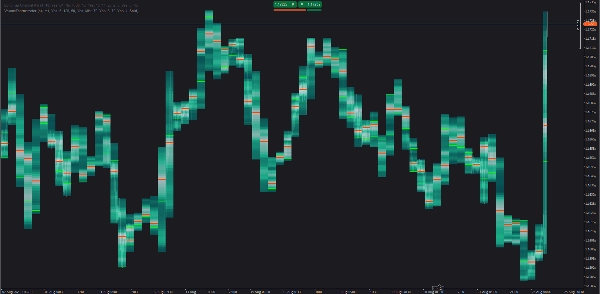
Peta haba cTrader yang menunjukkan bagaimana jumlah diedarkan di dalam setiap lilin HTF. Ia menggunakan bar LTF (contohnya, M1) untuk membina bin jumlah menegak, kemudian melukis POC dan Garis Kawasan Nilai (VA). Lilin HTF semasa (belum selesai) dilukis secara masa nyata.
Bagaimana ia berfungsi
- Mengagregatkan jumlah tik dari bar LTF.
- Memecahkan setiap lilin HTF kepada
Binirisan harga dan menetapkan jumlah berdasarkan pertindihan harga. - Mewarna bin mengikut jumlah relatif; melukis POC, garis VA pilihan, dan boleh memanjangkannya ke kanan.
- Memuatkan sejarah lama secara automatik untuk jangkauan yang kelihatan sahaja (kumpulan kecil).
Gunakannya
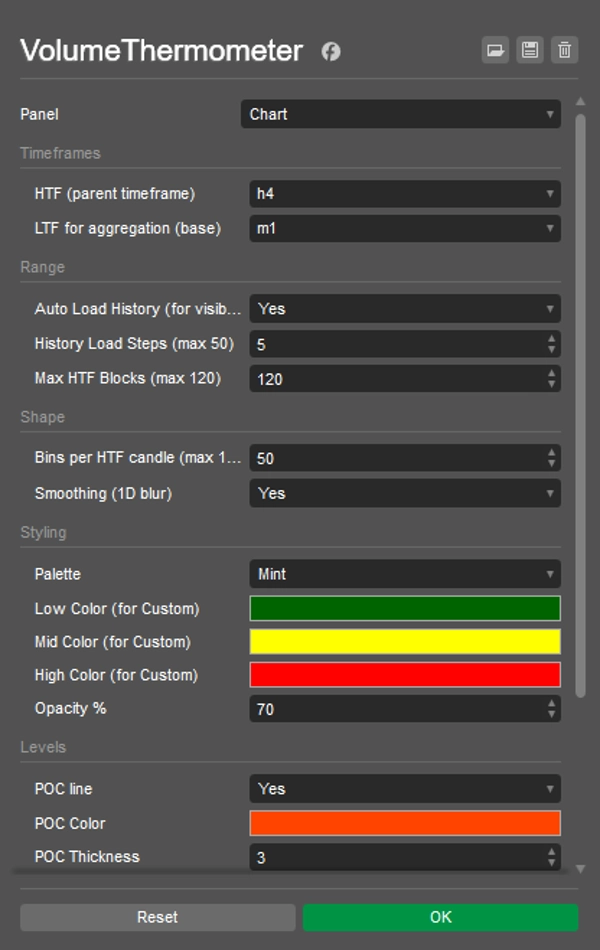
- Pilih HTF (contohnya, H4) dan LTF (contohnya, M1).
- Aktifkan Muat Sejarah Automatik; tatal/zoom ke julat yang anda mahu.
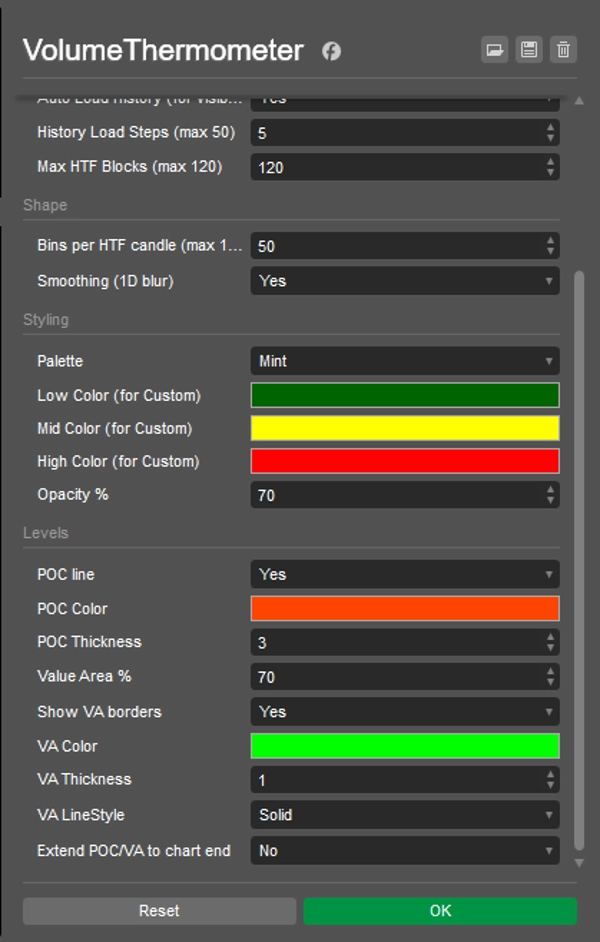
- Laraskan Bin (perincian), Blok HTF Maksimum (berapa banyak lilin untuk dipaparkan), Pelinciran, Ketelusan, dan warna.
- Perhatikan reaksi POC/VA dan bagaimana POC bergerak dari lilin ke lilin.
Idea cepat
- Ujian semula POC: sentuhan pertama POC sebelumnya dengan pengesahan LTF.
- Putaran VA: kemasukan semula ke VA sering menyasarkan tepi POC/VA lain.
- Laluan LVN: kawasan nipis (sejuk) cenderung bergerak cepat ke nod seterusnya.
Nota
- Menggunakan jumlah tik (proxy yang baik pada FX/CFD, bukan jumlah pertukaran).
- Untuk prestasi, kurangkan Bin atau Blok HTF Maksimum jika perlu.
Ringkasan
Ringkasan AI
VolumeThermometer is a cTrader indicator that visualizes intra-higher timeframe (HTF) volume distribution using a heatmap. It aggregates tick volume data from lower timeframe (LTF) bars (e.g., M1) to construct vertical volume bins within each HTF candle (e.g., H4). The indicator highlights the Point of Control (POC) and Value Area (VA) lines, showing where the most volume is concentrated by price level. The current HTF candle is updated in real time, and the indicator automatically loads historical data for the visible chart range in small batches to optimize performance.
Key features include:
- Aggregation of tick volume from LTF bars.
- Division of HTF candles into price bins with volume assigned by price overlap.
- Color-coded volume bins indicating relative volume intensity.
- Display of POC and optional VA lines, with the ability to extend these lines forward.
- Customizable settings for bin detail, maximum HTF candles displayed, smoothing, opacity, and colors.
- Supports multiple markets including Forex, indices, commodities, stocks, and cryptocurrencies such as BTCUSD and EURUSD.
Users can monitor POC retests, VA rotations, and low volume node pass-throughs to analyze volume behavior within HTF candles. The indicator uses tick volume as a proxy, suitable for FX and CFD markets.
Profil indikator
Ulasan pelanggan
0.0
Ulasan: 0
Ulasan pelanggan
Belum ada ulasan untuk produk ini. Anda sudah mencuba produk tersebut? Jadilah yang pertama untuk berkongsi pendapat anda!
Perbincangan
Soalan Lazim
BTCUSD
Prop
Forex
Indices
EURUSD
Commodities
Crypto
Stocks
NAS100
Produk yang tersedia melalui cTrader Store, termasuk bot dagangan, indikator dan plugin, disediakan oleh pembangun pihak ketiga dan diberikan akses untuk tujuan maklumat dan teknikal sahaja. cTrader Store bukan broker dan tidak memberikan nasihat pelaburan, syor peribadi atau sebarang jaminan prestasi masa hadapan.


Harga
Sejak 26/05/2025
451.48M
Volum yang didagangkan
61.16K
Pip dimenangi
15
Jualan
1.43K
Pemasangan percuma