
Penerangan
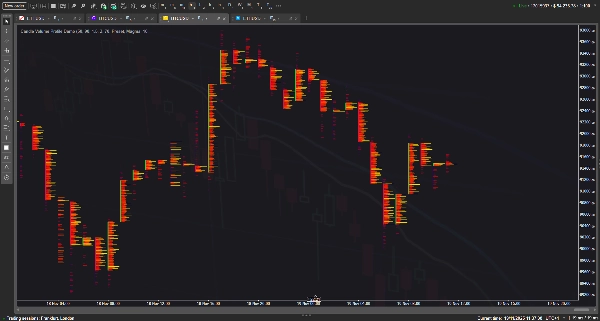
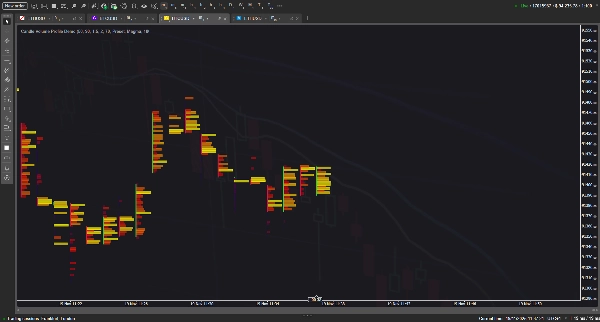
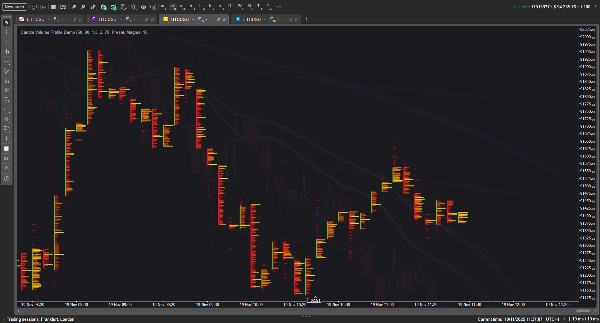
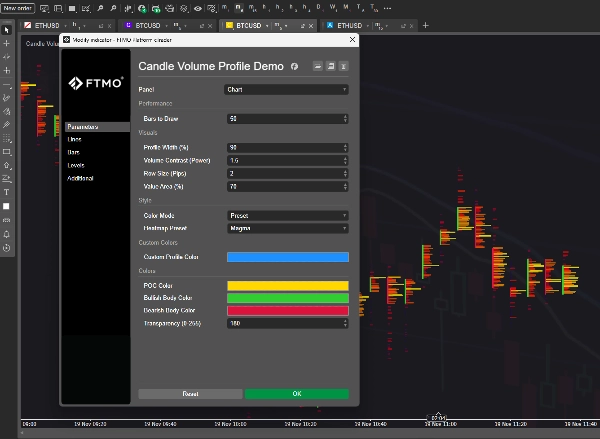
Penunjuk ini memvisualisasikan Profil Isipadu untuk bar individu, mengubah lilin standard menjadi carta gaya 'jejak' terperinci dengan peta haba yang boleh disesuaikan, garis Titik Kawalan (POC), dan blok Kawasan Nilai untuk menyerlahkan pengagihan isipadu setiap tahap harga. Ia bertujuan untuk meniru alat aliran pesanan profesional dengan menggunakan pengagihan isipadu heuristik untuk memaparkan aktiviti pasaran secara langsung pada carta.
Secara teori, konsep ini sepatutnya berfungsi dengan lancar untuk memberikan pandangan mendalam tentang pasaran; namun, dalam praktiknya, disebabkan oleh bilangan objek grafik yang sangat banyak diperlukan untuk rendering, semakin banyak ciri dan kedalaman sejarah yang anda minta dari penunjuk ini, semakin ia cenderung untuk mengalami kelewatan dan menyebabkan ketidakstabilan terminal. :(
Ringkasan
Ulasan pelanggan
5 | 0 % | |
4 | 100 % | |
3 | 0 % | |
2 | 0 % | |
1 | 0 % |


