
Cup Finder
อินดิเคเตอร์
156 ดาวน์โหลด
เวอร์ชัน 1.0, Feb 2026
Windows, Mac
ตั้งแต่ 03/10/2024
176
การขาย
45K
ติดตั้งฟรี
คำอธิบาย
The Cup Finder:
Indicator ทางเทคนิคความแม่นยำสูงที่ออกแบบมาเพื่อระบุและตรวจสอบโครงสร้างราคาที่โค้งมน—ที่รู้จักกันทั่วไปว่า "ถ้วย" และ "ถ้วยกลับหัว"—โดยใช้เรขาคณิตยูคลิดและการตรวจสอบความหนาแน่น
📊 การวิเคราะห์ตลาด & สภาพตลาด
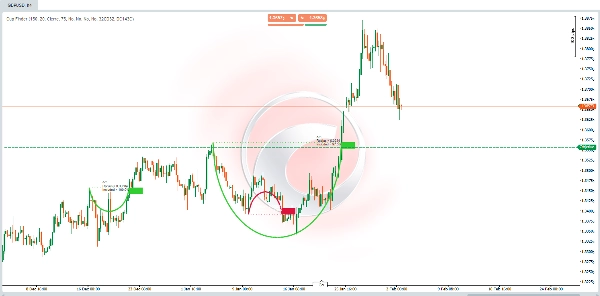
https://chartshots.spotware.com/c/6980ec8b2ee38
ตัวบ่งชี้นี้วิเคราะห์ จุดสูงสุดและต่ำสุดของราคา ภายในช่วงเวลาย้อนหลังทางประวัติศาสตร์ที่กำหนด มันมองหาโดยเฉพาะ:
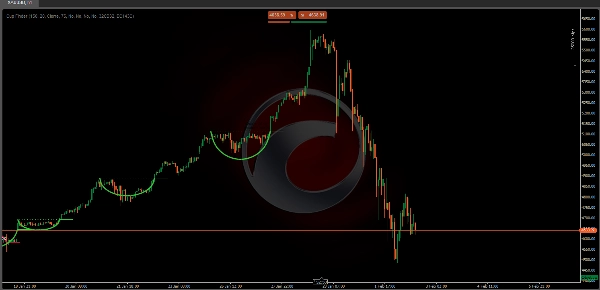
- ความโค้งของราคา: มันระบุจุดสูงสุดหรือต่ำสุดในท้องถิ่น (หน้าต่าง 30 แท่ง) เพื่อกำหนด "จุดยึด" ของรูปแบบที่เป็นไปได้
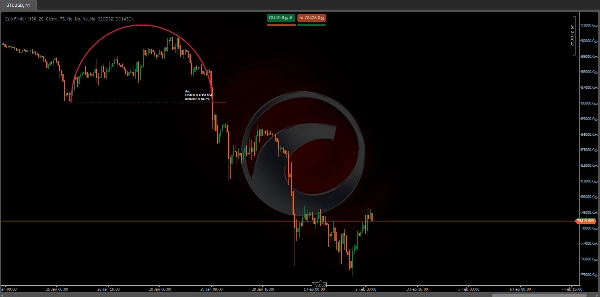
- เส้นทางเรขาคณิต: มันฉายโค้งครึ่งวงกลมทางคณิตศาสตร์ระหว่างจุดยึดและราคาปัจจุบัน
- การตรวจสอบความหนาแน่น: แตกต่างจากเครื่องมือที่ดูแค่ภาพ มันคำนวณว่าร้อยละขั้นต่ำของแท่งราคา (Content Rate) อยู่ภายในช่องราคาที่กำหนดรอบโค้งหรือไม่
🟢 วิธีการตีความสัญญาณ & ภาพประกอบ
https://chartshots.spotware.com/c/6980ed1a2d9e9
- โค้งสีเขียว (แนวโน้มขาขึ้น): บ่งชี้การก่อตัวของฐานโค้งมน มองหา เส้นประแนวนอน ซึ่งแสดงถึงระดับ "ขอบ" ของแนวต้าน
- โค้งสีแดง (แนวโน้มขาลง): บ่งชี้การก่อตัวของยอดโค้ง (vault) เส้นประแนวนอน แสดงระดับแนวรับที่ควรจับตา
- ป้ายข้อมูล:
-
- รัศมี: แสดงความลึกของรูปแบบในหน่วยราคา
- เปอร์เซ็นต์ที่รวม: คะแนน "ความแม่นยำทางเรขาคณิต" ยิ่งเปอร์เซ็นต์สูง หมายความว่าราคาปฏิบัติตามเส้นโค้งอย่างเคร่งครัดมากขึ้น
⚙️ การตั้งค่า & พารามิเตอร์สำคัญ
- ช่วงเวลาค้นหา (ค่าเริ่มต้น: 150): จำนวนแท่งที่อัลกอริทึมสแกนเพื่อหาจุดยึดทางประวัติศาสตร์ที่ถูกต้อง
- ความกว้างช่อง (ค่าเริ่มต้น: 20): กำหนด "ความหนา" ของโซนตรวจสอบโค้ง ค่าที่สูงกว่าจะยอมรับเสียงรบกวนของราคาได้มากขึ้น
- เปอร์เซ็นต์เนื้อหา (ค่าเริ่มต้น: 75): ร้อยละขั้นต่ำของแท่งราคาที่ต้องอยู่ภายในโค้งเพื่อให้แสดงผล
- แหล่งที่มาของการเบรคเอาท์: เลือกว่ารูปแบบจะถูกทริกเกอร์โดย ราคาปิด หรือ ราคาสูง/ต่ำ ที่ข้ามเส้นขอบ
🚀 กรณีการใช้งาน & สถานการณ์ทั่วไป
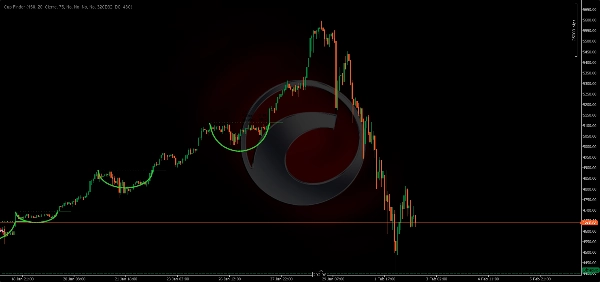
https://chartshots.spotware.com/c/6980eefccbe38
- การเทรดเบรคเอาท์: เข้าทำการซื้อขายเมื่อราคาทะลุและปิดเหนือ/ต่ำกว่าเส้นประแนวนอน (ขอบ)
- การระบุการกลับตัวของแนวโน้ม: การสังเกต "ฐานโค้ง" ที่จุดสิ้นสุดของแนวโน้มขาลง หรือ "ยอดโค้ง" ที่จุดสิ้นสุดของแนวโน้มขาขึ้น
- แนวรับ/แนวต้านเชิงโครงสร้าง: ใช้เส้นขอบเป็นระดับสำคัญสำหรับการตั้งจุดหยุดขาดทุนหรือทำกำไร
👤 โปรไฟล์ผู้เทรดเป้าหมาย
- เทรดเดอร์ที่ใช้การเคลื่อนไหวของราคา: ผู้ที่มองหาเรขาคณิตตลาดและความเหนื่อยล้าของโครงสร้าง
- เทรดเดอร์เชิงระบบ: ผู้ใช้ที่ต้องการลดความเป็นอัตวิสัยของการ "วาดถ้วย" ด้วยมือและชอบการยืนยันทางคณิตศาสตร์
- ระดับประสบการณ์: เหมาะสำหรับเทรดเดอร์ระดับกลางถึงขั้นสูงที่เข้าใจการยืนยันเบรคเอาท์และแนวคิดแนวรับ/แนวต้าน
⚠️ ข้อจำกัดสำคัญ & หมายเหตุการใช้งาน
- ประวัติขั้นต่ำที่ต้องการ: ตัวบ่งชี้ต้องการข้อมูลอย่างน้อย 292 แท่ง เพื่อเริ่มต้นการคำนวณภายใน
- ลักษณะล่าช้า: เนื่องจากมันตรวจสอบเส้นโค้งจากข้อมูลในอดีต โค้งจะปรากฏขึ้นเมื่อการ "โค้งมน" ได้พัฒนาอย่างมีนัยสำคัญแล้วเท่านั้น
- การวาดซ้ำ/อัปเดต: เมื่อราคาพัฒนา โค้งอาจปรับรัศมีหรือหายไปถ้า "เปอร์เซ็นต์ที่รวม" ต่ำกว่าค่าที่ตั้งไว้
สรุป
AI summary
Cup Finder is a technical indicator designed to identify and validate rounding price patterns known as "Cups" and "Inverted Cups" using Euclidean geometry and density-based validation. It analyzes high and low price pivots over a historical lookback period to detect price curvature by identifying local peaks or troughs within a 30-bar window, establishing an anchor point for potential patterns. The indicator projects a semicircular arc between this anchor and the current price and calculates a content rate to confirm that a minimum percentage of bars remain within a defined price channel around the arc.
Visual signals include green arcs indicating bullish rounding bottoms with a horizontal dotted resistance line, and red arcs indicating bearish rounding tops with a support line. Information labels display the pattern's radius and geometric accuracy percentage. Key adjustable parameters include search period, channel amplitude, content rate threshold, and breakout source (close or high/low crossing the rim line).
Typical use cases involve breakout trading, trend reversal identification, and defining structural support or resistance levels. The indicator targets intermediate to advanced price action and systematic traders seeking mathematical confirmation of rounding patterns. It requires at least 292 bars of historical data and may repaint or update arcs as price evolves. Supported markets include Forex, stocks, commodities, indices, and cryptocurrencies such as BTCUSD, EURUSD, GBPUSD, and XAUUSD.
Visual signals include green arcs indicating bullish rounding bottoms with a horizontal dotted resistance line, and red arcs indicating bearish rounding tops with a support line. Information labels display the pattern's radius and geometric accuracy percentage. Key adjustable parameters include search period, channel amplitude, content rate threshold, and breakout source (close or high/low crossing the rim line).
Typical use cases involve breakout trading, trend reversal identification, and defining structural support or resistance levels. The indicator targets intermediate to advanced price action and systematic traders seeking mathematical confirmation of rounding patterns. It requires at least 292 bars of historical data and may repaint or update arcs as price evolves. Supported markets include Forex, stocks, commodities, indices, and cryptocurrencies such as BTCUSD, EURUSD, GBPUSD, and XAUUSD.
โปรไฟล์อินดิเคเตอร์
รีวิวจากลูกค้า
0.0
รีวิว: 0
รีวิวจากลูกค้า
ยังไม่มีรีวิวสำหรับผลิตภัณฑ์นี้ หากเคยลองแล้ว ขอเชิญมาเป็นคนแรกที่บอกคนอื่น!
การสนทนา
คำถามที่พบบ่อย
BTCUSD
Forex
Breakout
Indices
EURUSD
Commodities
GBPUSD
NZDUSD
Prop
Crypto
Stocks
XAUUSD
NAS100
USDJPY
ผลิตภัณฑ์ที่มีให้บริการผ่าน cTrader Store รวมถึงบอทการเทรด อินดิเคเตอร์ และปลั๊กอิน มีให้บริการโดยนักพัฒนาบุคคลที่สามและมีไว้เพื่อวัตถุประสงค์ในการเข้าถึงข้อมูลและทางเทคนิคเท่านั้น cTrader Store ไม่ใช่โบรกเกอร์และไม่ได้ให้คำแนะนำการลงทุน คำแนะนำส่วนบุคคล หรือการรับประกันผลการดำเนินงานในอนาคต





























ราคา
ตั้งแต่ 03/10/2024
176
การขาย
45K
ติดตั้งฟรี