Penerangan
🏆 10,000+ Pedagang Mempercayai Suite Algoritma 25+ Kami! 🏆
Dari Struktur Pasaran & Kecairan ke Sistem Keluar Pintar & Alat Ramalan - kami telah membina SETIAP alat yang anda perlukan untuk konsisten.
👉 Akses Semua 25+ Sistem TERBUKTI:
_______________________________________________
📌 Penunjuk Struktur Pasaran
· ✅ Struktur Pasaran Lanjutan: Bos, Choch, SwinLevels, Blok Pesanan, Pencari Struktur Pasaran& Kecairan
· 🔄 Analisis Struktur Pasaran Dinamik Titik Pusing
· 🧱 Blok Pesanan
· ⚖️ Ketidakseimbangan Pasaran
· ⛓️ BOS & CHOCH
· 🧠 Kuasa ICT 3
_______________________________________________
🔚 Sistem Keluar Pintar
_______________________________________________
📐 Penunjuk ZigZag
· 🔍 Unjuran Kecairan Harga ZigZag
· ➖ ZigZag
· 🎯 Penjejak Extremity Zig-Zag
_______________________________________________
🧱 Penunjuk Sokongan & Rintangan
· 🟩 Garis Sokongan & Rintangan SmartTrend
· 🧱 Semua Tahap Sokongan dan Rintangan
_______________________________________________
📊 Penunjuk Trend & Saluran
· 📊 Supertrend
· ⚡Penganalisis Trend Momentum
_______________________________________________
💧 Alat Isipadu & Kecairan
· 🔍 Jurang Nilai Adil Momentum
_______________________________________________
⚡ Penunjuk Momentum & RSI
· 🔎 Penjejak Bias Lilin Berbilang Tahap
Tracker
_______________________________________________
🔮 Alat Ramalan & Unjuran
· 📐 Ramalan Berdasarkan Linreg& ATR
· 📏 Regresi Linear FibonacciBerbilang jangka masa
· 📈 Pemproyektor Aliran Pasaran Digerakkan oleh Isipadu_________________________
_________________________________________________________________________________________________
_________________________________________________________________________________________________
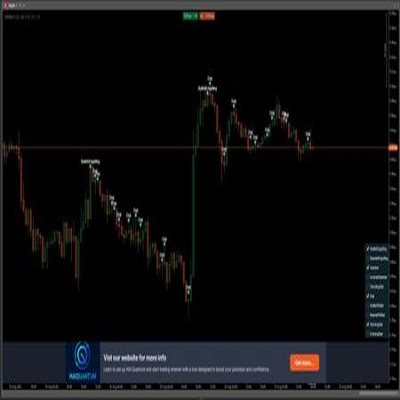
PENCETUS SALURAN RSI: 📶
Apa itu: Penunjuk yang mengira RSI(tempoh) dan menandakan zon momentum secara visual apabila RSI melintasi ambang terlebih beli/terlebih jual (lalai 70/30). ✅
https://chartshots.spotware.com/c/69278f8b6d973
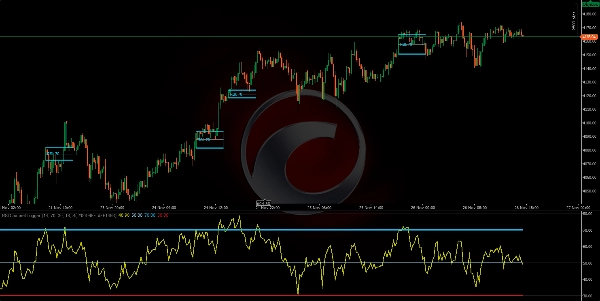
Logik: Apabila ambang dilintasi, ia mencipta "zon" berdasarkan tinggi/rendah lilin pada saat lintasan. Kemudian: 🧠
- Mewarna lilin di dalam zon tersebut.
- Melukis saluran (tinggi, rendah, tengah).
- Menandakan lintasan pada panel RSI dengan bulatan dan label.
Zon itu berlangsung selama tepat MinZoneDuration bar. ⏱️
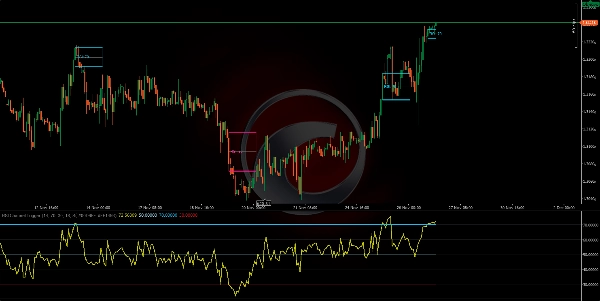
Isyarat jelas:
- Lintasan di atas Terlebih Beli → memulakan zon bullish. 🟢
- Lintasan di bawah Terlebih Jual → memulakan zon bearish. 🔴
Zon itu sendiri adalah kawasan minat, bukan pesanan.
https://chartshots.spotware.com/c/69278fb274e0b
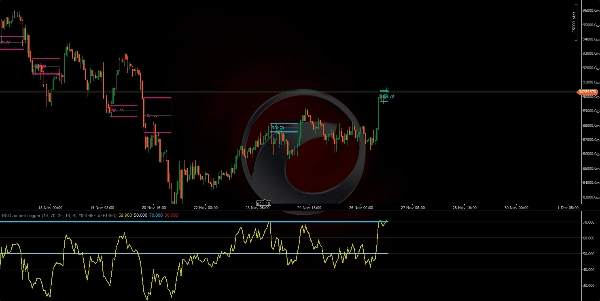
Cara guna (cepat):
- Tunggu zon terbentuk. 🎯
- Sahkan dengan tindakan harga (pecahan/penolakan dari garis saluran).
- Masuk dengan stop loss di luar zon dan sasaran di garis tengah saluran atau nisbah Risiko/Imbangan yang ditetapkan.
https://chartshots.spotware.com/c/69278fe76237b
Parameter Utama: ⚙️
- Tempoh RSI (14)
- Terlebih Beli (70)
- Terlebih Jual (30)
- MinZoneDuration (15)
- Warna boleh dikonfigurasikan 🎨
Ringkasan
Clear signals include:
- RSI crossing above the overbought level, initiating a bullish momentum zone.
- RSI crossing below the oversold level, initiating a bearish momentum zone.
These zones serve as areas of interest rather than direct trade orders. Users can confirm signals with price action such as breakouts or rejections from channel lines and plan entries with stop losses placed outside the zone and targets at the mid-channel line or based on risk/reward ratios.
The indicator supports multiple markets and symbols including Forex pairs (EURUSD, GBPUSD, NZDUSD, USDJPY), commodities (XAUUSD), indices (NAS100), cryptocurrencies (BTCUSD), and stocks. It offers configurable parameters for RSI period, threshold levels, zone duration, and colors.