説明
▁▂▃▄▅▆▇ █ 10,000+ トレーダー(機関投資家+個人投資家) █ ▇▆▅▄▃▂▁
- cTraderで当社のTOPインジケーターを選択 🏆
- ✨ 優れた結果のための独占的な精度 ✨
- 📈 当社のアルゴリズム —最高評価のビジュアル🎯—
- は2つのクオンツファンドで成功裏に実装されています
▁▂▃▄▅▆▇ █████████████████████████████ ▇▆▅▄▃▂▁
_______________________________________________
_______________________________________________
📌 マーケット構造インジケーター
· ✅ AdvancedMarket Structure: Bos, Choch, SwinLevels, Order Blocks, Market Structure&流動性ファインダー
· 🔄 ダイナミックマーケット構造 ターニングポイントの分析
· 🧱 オーダーブロック
· ⚖️ マーケットアンバランス
· ⛓️ BOS & CHOCH
· 🧠 ICT パワーオブ3
· 🌀 マーケットポラリティゾーン
______________________________________________________________-
ストア cBots : 🧠 ゴールド&BTC ブレイクアウトセッションピボット 🧠
_______________________________________________
🔚 スマートエグジットシステム
· 📍 トレーリングスマートアルゴリズム
_______________________________________________
📐 ジグザグインジケーター
· 🔍 ジグザグ価格流動性予測
· 🧭 S&R 構造的ジグザグ
· ➖ ジグザグ
· 🎯 ジグザグ極端トラッカー
_______________________________________________
🧱 サポート&レジスタンスインジケーター
_______________________________________________
📊 トレンド&チャネルインジケーター
· 🔄 オートトレンドチャネル
· 📊 スーパートレンド
· 🧠 アダプティブトレンドチャネル
· 💥 チャネルブレイクアウトシステム
· ⭐ プレミアムSSLチャネル
· 🔁 リアクティブ移動平均
_______________________________________________
💧 ボリューム&流動性ツール
· 🔥 ボリュームPOCヒートマップ
· 📉 レバレッジ清算マップ
· 🔍 モメンタムフェアバリューギャップ
· 🕒 フェアバリューギャップセッション
_______________________________________________
⚡ モメンタム&RSIインジケーター
· 📈 RSIトレンドトリガー
· 🚀 ダイナミックレンジモメンタム
_______________________________________________
🔮 予測&投影ツール
· 📐 Linreg&ATRに基づく予測
______________________________________________________________________________________________________
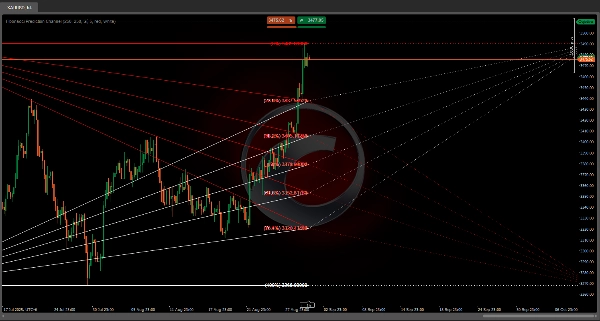
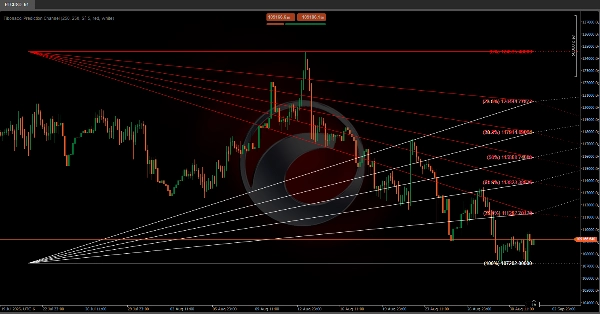
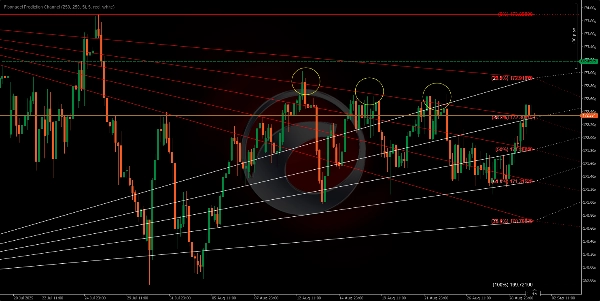
このアルゴリズムは、フィボナッチリトレースメントレベルに基づいて将来の予測チャネルを描画するよう設計されています📊✨。フィボナッチラインは、連続する各レベルのペア間に一連の平行チャネルを作成します。これらのチャネルは、価格が変動すると予想される範囲として解釈でき、価格が相互作用する視覚的なコーンを生成します🎯。レベルが破られた場合⚡、次のレベルに移動します。
これらの将来に投影されたレベルは、サポートおよびレジスタンスとしても機能し🛡️⚔️、チャート上に視覚的なチャネルを作成して、過去に価格がこれらのレベルにどのように反応したかに基づいて行動を予測し計画するのに役立ちます🧠✅。
価格がこれらのラインに近づくと反応が期待でき、チャネル内で跳ね返る可能性があります🔄。または、十分なモメンタムがあれば🚀、ラインを突破して次のチャネルに移動します。
右側に投影されたレベル➡️🗓️は新しい価格データに基づくものではなく、過去の価格動向に基づいています⏳。これらは将来の潜在的な価格反応のための一種の「地図」🗺️として未来に延長されます。
ヒストリカルバー⏰:フィボナッチリトレースメントレベルを計算する際に考慮される過去の価格期間の数を決定します。