
Penerangan
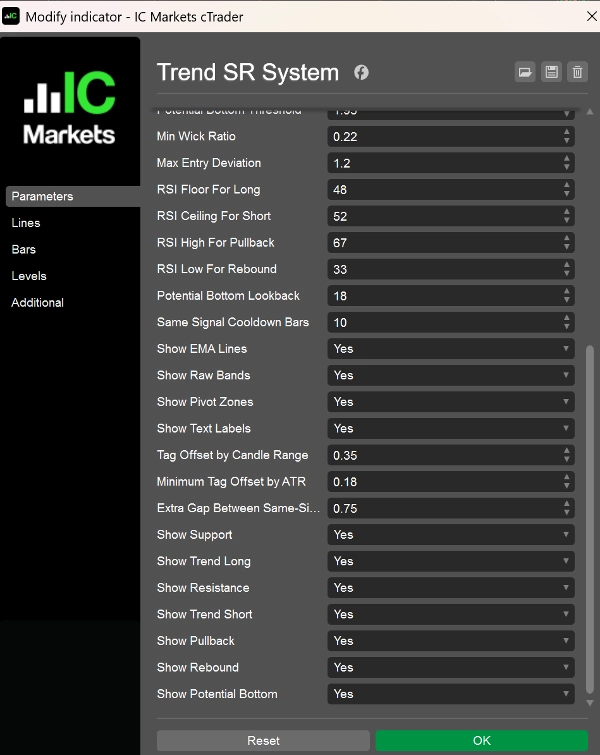
Trend SR System adalah penunjuk carta berorientasikan tren yang direka untuk membantu pedagang mengenal pasti konteks pasaran, struktur EMA utama, tahap sokongan/rintangan dinamik, dan zon sambungan atau pembalikan purata jangka pendek dengan lebih jelas.
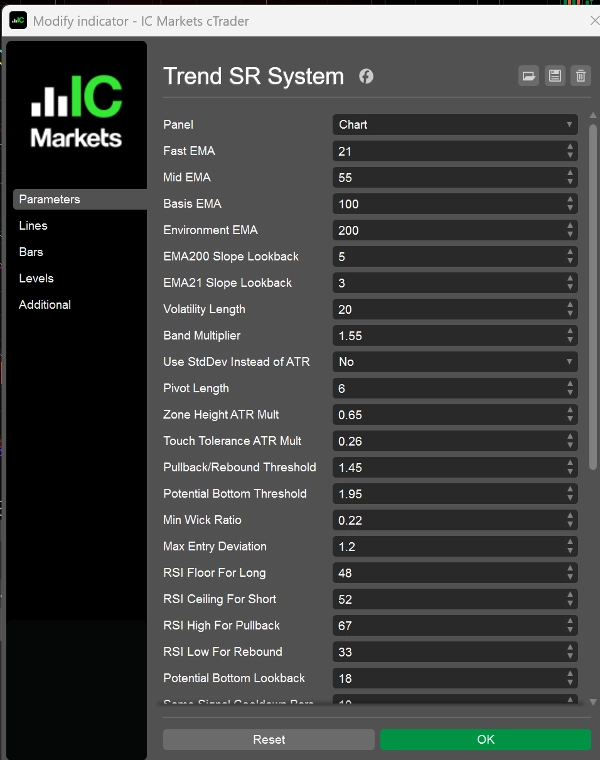
Penunjuk ini dibina di sekitar EMA21, EMA55, EMA100, dan EMA200:
- EMA200 digunakan sebagai penapis persekitaran pasaran peringkat tinggi
- EMA100 bertindak sebagai paksi harga pusat dan garis asas jalur
- EMA55 membantu mengenal pasti tekanan sokongan dan rintangan jangka sederhana
- EMA21 digunakan untuk mengesan irama jangka pendek, penarikan balik, dan retracement
Selain itu, penunjuk ini menggabungkan jalur volatiliti, zon struktur berasaskan pivot, dan logik sokongan/rintangan dinamik bergaya langkah untuk memberikan pandangan pasaran yang lebih tersusun.
Ciri Utama
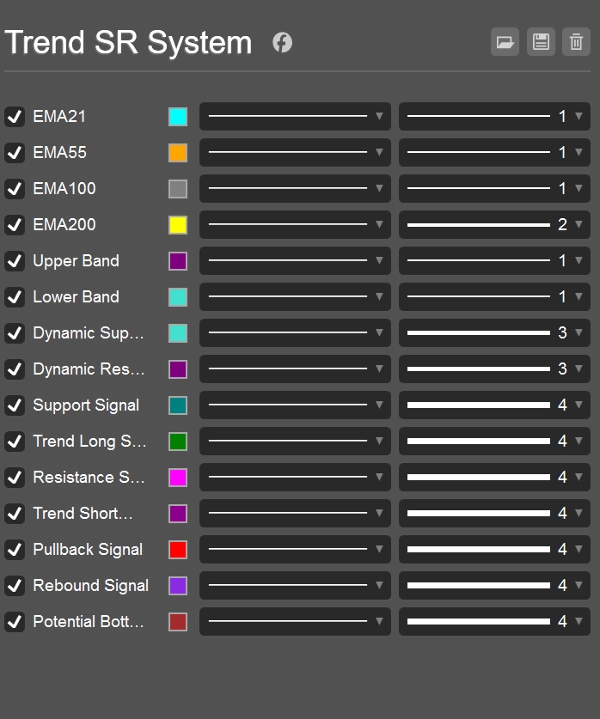
- Memaparkan 4 garis struktur EMA utama
- Menunjukkan jalur atas dan bawah berdasarkan ATR atau sisihan piawai
- Menjana tahap sokongan dan rintangan dinamik
- Mengesan kawasan sokongan/rintangan struktur menggunakan logik pivot
- Menyediakan isyarat jenis sambungan dan pembetulan jangka pendek
- Membolehkan jenis isyarat individu dihidupkan atau dimatikan
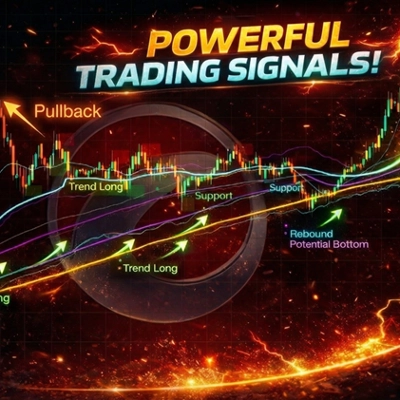
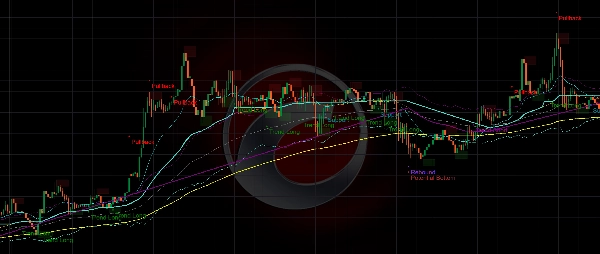
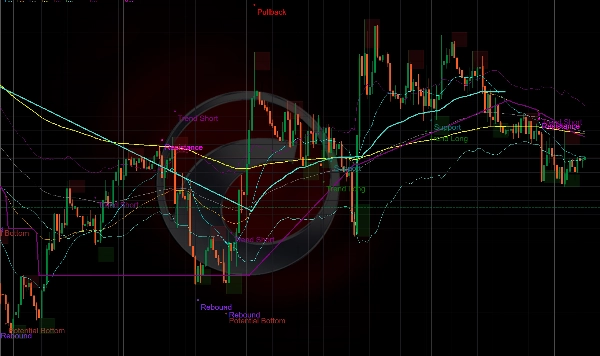
Jenis Isyarat
- Sokongan
Kawasan sokongan utama dalam persekitaran menaik, menunjukkan bahawa harga sedang dipertahankan selepas penarikan balik. - Trend Panjang
Isyarat panjang mengikuti tren dalam pasaran menaik, biasanya muncul selepas penarikan balik menyambung momentum ke atas. - Rintangan
Kawasan rintangan utama dalam persekitaran menurun, menunjukkan bahawa harga sedang dibatasi selepas retracement. - Trend Pendek
Isyarat pendek mengikuti tren dalam pasaran menurun, biasanya muncul selepas pantulan kehilangan kekuatan dan tren ke bawah disambung semula. - Penarikan Balik
Amaran terlebih jangka pendek dalam persekitaran menaik, menunjukkan risiko penarikan balik atau pengukuhan. - Pantulan
Amaran terlebih jual jangka pendek dalam persekitaran menurun, menunjukkan risiko pantulan teknikal. - Potensi Dasar
Isyarat pemulihan terlebih jual yang lebih kuat, menonjolkan kemungkinan cubaan membentuk dasar sementara.
Kes Penggunaan Tipikal
Penunjuk ini sesuai untuk:
- Analisis mengikuti tren
- Masa kemasukan penarikan balik dan retracement
- Pemerhatian struktur EMA dan sokongan/rintangan
- Memantau keadaan terlebih beli atau terlebih jual yang berlebihan
- Penapisan perdagangan berasaskan carta dan sokongan keputusan budi bicara
Ia boleh digunakan merentasi forex, indeks, logam, kripto, dan pasaran trending lain.
Terbaik Untuk
Penunjuk ini direka untuk pedagang yang:
- Mahukan pandangan carta yang lebih jelas dan tersusun
- Menumpukan pada sambungan tren dan zon reaksi utama
- Menggunakan struktur EMA bersama tingkah laku harga dan sokongan/rintangan
- Mengutamakan bantuan perdagangan visual untuk persediaan jangka pendek hingga sederhana
Nota Penggunaan
- Sebaiknya digunakan bersama konteks pasaran dan pengurusan risiko yang baik
- Isyarat tidak harus dianggap sebagai nasihat perdagangan berdiri sendiri
- Kualiti isyarat mungkin menurun semasa keadaan pasaran yang tidak menentu atau volatiliti rendah
- Ini bertujuan sebagai alat analisis carta dan sokongan perdagangan, bukan sistem prestasi terjamin
Ringkasan
AI summary
Trend SR System is a trend-focused trading indicator that integrates four key exponential moving averages (EMA21, EMA55, EMA100, EMA200) with volatility bands and dynamic support/resistance levels. EMA200 serves as a higher-level market environment filter, EMA100 as the central price axis, EMA55 to identify medium-term support/resistance pressure, and EMA21 to track short-term price rhythm and pullbacks. The indicator overlays volatility bands based on ATR or standard deviation and uses pivot-based logic to detect structural support and resistance zones.
It provides multiple signal types including support, resistance, trend-following longs and shorts, pullback warnings, rebounds, and potential bottom formations. These signals assist in identifying continuation setups and short-term mean-reversion opportunities. Users can enable or disable individual signal types according to their preferences.
Designed for use across forex, indices, commodities, metals, cryptocurrencies, and other trending markets, the Trend SR System supports trend-following analysis, entry timing on pullbacks, and monitoring of EMA structure alongside price behavior. It is intended as a chart analysis and trade support tool to enhance visual clarity of market context and key reaction zones, best used in conjunction with sound risk management and broader market analysis.
It provides multiple signal types including support, resistance, trend-following longs and shorts, pullback warnings, rebounds, and potential bottom formations. These signals assist in identifying continuation setups and short-term mean-reversion opportunities. Users can enable or disable individual signal types according to their preferences.
Designed for use across forex, indices, commodities, metals, cryptocurrencies, and other trending markets, the Trend SR System supports trend-following analysis, entry timing on pullbacks, and monitoring of EMA structure alongside price behavior. It is intended as a chart analysis and trade support tool to enhance visual clarity of market context and key reaction zones, best used in conjunction with sound risk management and broader market analysis.
Profil indikator
Kategori indikator
Trend
Jenis output
Isyarat
Keperluan data
Bar sahaja
Isyarat yang disokong
Pembalikan
Terobosan
Kekuatan trend
Ulasan pelanggan
4.0
Ulasan: 3
5 | 0 % | |
4 | 100 % | |
3 | 0 % | |
2 | 0 % | |
1 | 0 % |
Ulasan pelanggan
April 9, 2026
a quiet demo run gives a better read. The chart idea becomes easier to explain.
April 8, 2026
April 5, 2026
Perbincangan
Soalan Lazim
Prop
Forex
Signal
Indices
Supertrend
Commodities
RSI
Crypto
Stocks
ATR
Produk yang tersedia melalui cTrader Store, termasuk bot dagangan, indikator dan plugin, disediakan oleh pembangun pihak ketiga dan diberikan akses untuk tujuan maklumat dan teknikal sahaja. cTrader Store bukan broker dan tidak memberikan nasihat pelaburan, syor peribadi atau sebarang jaminan prestasi masa hadapan.
Lebih banyak produk daripada penulis ini


















Harga
Sejak 25/03/2026