🚀 أكثر من 10,000 متداول يستخدمون مؤشراتنا TOP بالفعل 🏆 … والمجتمع يستمر في النمو!
اكتشف لماذا يختارنا المحترفون – أقوى أدوات cTrader (المؤشرات + الخوارزميات + cBots) في انتظارك.
👉 احصل على جميع أنظمتنا TOP هنا:
مؤشرات متجر Pinescriptlabs: cBots متجر Pinescriptlabs : (cBot) انفجار الذهب و BTCمحاور الجلسة(جديد)
هيكل السوق المتقدم: Bos, Choch, SwinLevels, كتل الأوامر، هيكل السوق & مكتشف السيولة (جديد)
خوارزمية ذكية متتبعة (جديد)
دعم SmartTrend &
المقاومة
الخطوط
تحليل
هيكل السوق الديناميكي
لـ
نقاط
الانعطاف
فيبوناتشي
انحدار خطي
متعدد الأطر الزمنية
Regression
متعدد المستويات
تتبع ميل الشمعة
المتعقب
جميع
مستويات الدعم
والمقاومة
المستويات
مناطق استقطاب السوق 📊
ماذا يفعل هذا الخوارزم؟
مناطق استقطاب السوق هو مؤشر متقدم يبسط تحليل السوق من خلال تحديد تلقائي مراحل صعودية 🚀 أو هبوطية 🐻 وتحديد المستويات الرئيسية حيث من المحتمل حدوث انعكاسات الاتجاه.
مثالي لـ:
- متداولي حركة السعر
- متداولي السوينغ
- المتداولين السريعين,... الذين يحتاجون إلى تحديد سريع اتجاه السوق و نقاط دخول/خروج دقيقة.
كيف تعمل المنطق؟
تستخدم الخوارزمية متوسطين متحركين هول (HMA) بفترات مختلفة لاكتشاف تغيرات الزخم وتحدد مستويات ديناميكية كما يلي:
- تكتشف تقاطعات HMA لتحديد تغيرات الاتجاه.
- تحدد مستويات تلقائية:
-
- تقاطع صعودي → يحدد القاع كمستوى دعم
- تقاطع هبوطي → يحدد القمة كمستوى مقاومة
- يحافظ على المستوى النشط حتى يحدث تقاطع جديد.
ما الذي سترى على الرسم البياني الخاص بك:
🎨 نظام ألوان بديهي:
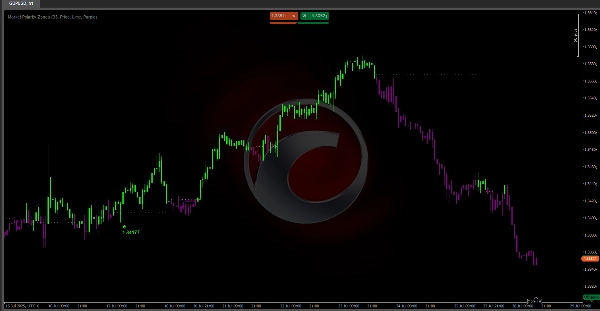
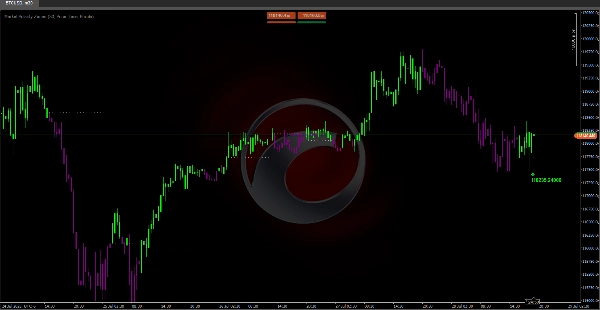
- شموع خضراء 🟢: السعر فوق المستوى (منطقة صعودية – ابحث عن عمليات شراء)
- شموع بنفسجية 🟣: السعر تحت المستوى (منطقة هبوطية – ابحث عن عمليات بيع)
📉 خطوط المستوى الديناميكية:
- خطوط أفقية منقطة تحدد مستوى الاستقطاب النشط
- تمتد تلقائيًا طالما ظل المستوى صالحًا
- تظهر فقط عندما يستقر المستوى
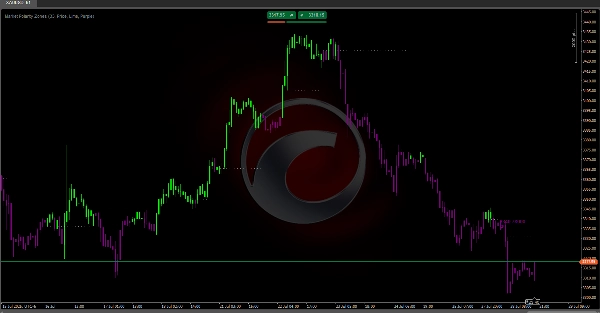
⚠️ تنبيهات الانعكاس:
تظهر علامات الأسهم عند تكوين أنماط محددة:
- 🔻 انعكاس هبوطي (علامة بنفسجية):
-
- النمط: يرتفع السعر → يفشل → ينخفض تحت المستوى
- المعنى: ضعف الضغط الصعودي، احتمال التحول إلى المنطقة الهبوطية
- 🔺 انعكاس صعودي (علامة خضراء):
-
- النمط: ينخفض السعر → يرتد → يرتفع فوق المستوى
- المعنى: المشترين يدافعون عن المستوى، احتمال التحول إلى المنطقة الصعودية
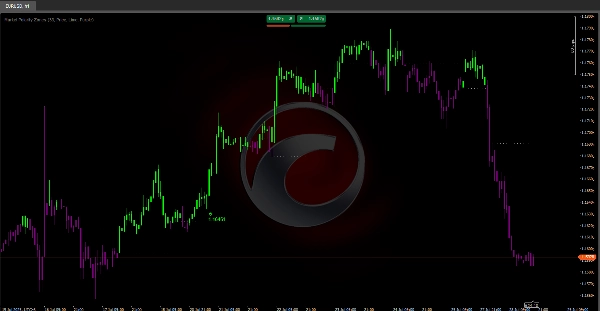
ℹ️ معلومات العلامة:
- "السعر": يعرض نقطة فشل الاختراق الدقيقة – استخدمها لإيقافات دقيقة أو لتحديد المقاومة/الدعم الرئيسي.
- "الحجم": مجموع حجم آخر 3 أشرطة – يؤكد ما إذا كان الانعكاس له مشاركة فعلية في السوق.
الإعدادات الموصى بها:
- الطول: 33 (افتراضي) – يعمل جيدًا لمعظم الأسواق
- بيانات العلامة: "السعر" للدقة في المستوى، "الحجم" للتأكيد
- الألوان: احتفظ بلون الليمون/البنفسجي لأفضل تباين بصري 🎨