
Descrição
QX RiskShield é um calculador de risco no gráfico que converte sua distância do stop em tamanho exato da posição (Unidades e Lotes), além dos níveis de preço SL/TP baseados em suas metas R:R. Foi projetado para tomada de decisão rápida com mínimo excesso de informações no gráfico.
Este é um apenas indicador. Ele não realiza ordens.
O que você vê:
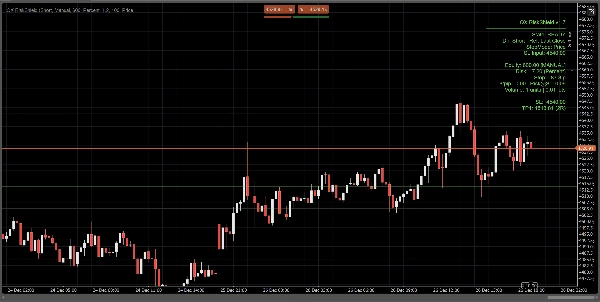
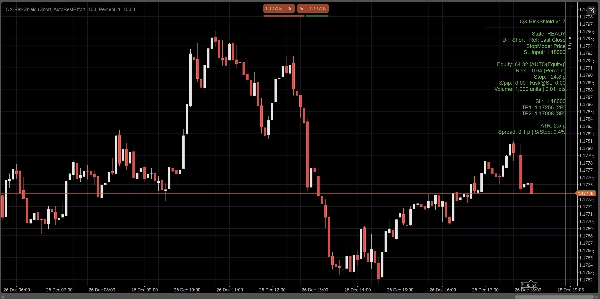
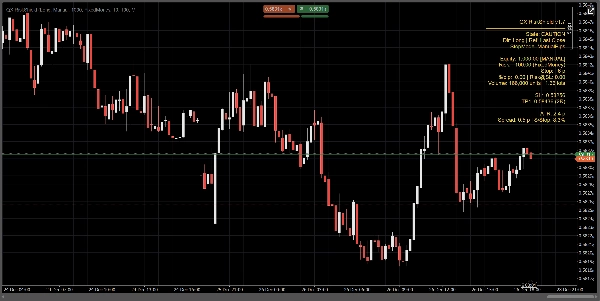
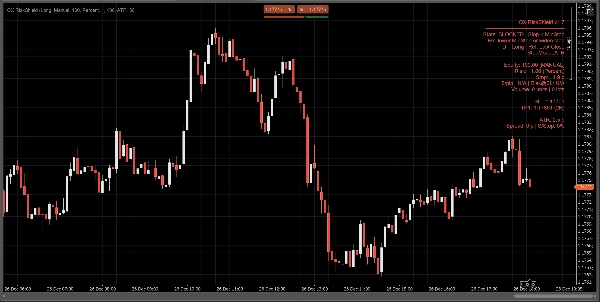
Um painel compacto mostra, de relance:
- Estado: PRONTO / CUIDADO / BLOQUEADO
- Fonte do patrimônio: Manual ou Automático (melhor esforço, fallback seguro)
- Quantidade de risco: % do patrimônio ou risco fixo em dinheiro
- Distância do stop: em pips
- Tamanho da posição: Unidades + Lotes (normalizado para restrições do corretor)
- $/pip e Risco@SL (risco estimado no stop)
- Níveis de preço SL / TP1 / TP2 (baseados em suas metas RR)
- Linhas opcionais de Entrada / SL / TP no gráfico para referência visual
Todos os cálculos são baseados no Último Fechamento (estável, sem flicker intrabar).
Modos de stop:
Escolha como seu stop é definido:
1) Pips Manuais
Defina uma distância fixa de stop em pips.
2) Stop ATR
Distância do stop = ATR(pips) × k do ATR.
Útil para dimensionamento adaptativo à volatilidade entre símbolos.
3) Stop por Preço
Defina o preço exato do SL (melhor para trading discricionário).
RiskShield converte essa distância de preço em pips e dimensiona a posição de acordo.
Lógica de estado (sem confusão):
RiskShield usa estados claros para que os usuários entendam imediatamente o que está acontecendo:
PRONTO
Entradas são válidas. Dimensionamento da posição disponível.
CUIDADO
O dimensionamento é válido, mas o RiskShield detectou um stop apertado em relação ao ATR.
Isto é um aviso, não um bloqueio.
BLOQUEADO
O dimensionamento é intencionalmente desativado quando as regras são inseguras ou inválidas, tais como:
- Stop abaixo do limite mínimo de stop
- Preço SL do lado errado do preço de referência
- Spread muito alto em relação ao stop (Spread/Stop %)
- Volume estaria abaixo do mínimo do corretor
- Dados de pip/lote do símbolo não disponíveis
Uma dica curta de “Correção” pode ser mostrada (opcional) para corrigir entradas rapidamente.
Como os traders usam o QX RiskShield (fluxo de trabalho simples)
- Anexe o QX RiskShield ao seu gráfico.
- Selecione Direção da Trade (Longa ou Curta).
- Escolha seu Tipo de Risco:
-
- Porcentagem do patrimônio, ou
- Risco fixo em dinheiro por trade
- Escolha Modo de Stop:
-
- Pips manuais, ATR, ou preço SL
- Leia o resultado:
-
- Use Unidades/Lotes para o tamanho da sua ordem
- Use níveis SL/TP como seus preços de referência
- Se o painel mostrar CUIDADO, considere ampliar o stop ou usar o modo ATR.
- Se o painel mostrar BLOQUEADO, ajuste as entradas até ficar PRONTO.
Opções de UI (projetadas para gráficos limpos):
- Modo do Painel: Simples ou Pro
- Densidade do Painel: Normal ou Compacto (para texto mínimo)
- Mostrar Sugestão de Correção: Ligado/Desligado
- Mostrar Linhas: Ligado/Desligado
- Mostrar Linha de Entrada: Ligado/Desligado
- Controles de alinhamento do painel e limitação de atualização para desempenho
Desempenho e estabilidade:
- Usa Último Fechamento para cálculos. Sem comportamento de repintura.
- Limitação de atualização para reduzir uso de CPU em áreas de trabalho ocupadas.
- Tratamento defensivo para dados de símbolos, restrições do corretor e campos de conta ausentes.
Notas importantes:
- QX RiskShield é uma ferramenta de suporte à decisão, não um conselho financeiro.
- Os resultados dependem das especificações do símbolo do seu corretor (valor do pip, tamanho do lote, volume mínimo, etc.).
- O patrimônio automático é melhor esforço. Se a plataforma restringir o acesso, o RiskShield recorre com segurança ao patrimônio manual.
Ideal para:
- Traders de FX Majors e índices
- Regras de risco estilo prop firm
- Scalpers e day traders que querem dimensionamento rápido com verificações rigorosas de segurança
- Traders que preferem SL baseado em preço mas ainda querem dimensionamento automatizado
Trade com controle. Dimensione com precisão.
Resumo
Avaliações de clientes
5 | 0 % | |
4 | 100 % | |
3 | 0 % | |
2 | 0 % | |
1 | 0 % |


