คำอธิบาย
📌 CandleColourFlow_Limited_EURUSD – รุ่นสาธิต
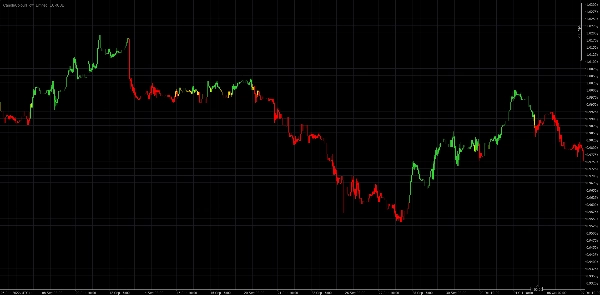
CandleColourFlow เป็นตัวบ่งชี้นวัตกรรมที่ออกแบบมาเพื่อระบุแนวโน้มและจุดเปลี่ยนของตลาดฟอเร็กซ์ได้อย่างชัดเจนและรวดเร็ว ด้วยระบบสีที่เรียบง่ายและเข้าใจง่าย แม้แต่ผู้เริ่มต้นก็สามารถตัดสินใจซื้อขายได้อย่างมีข้อมูลมากขึ้น
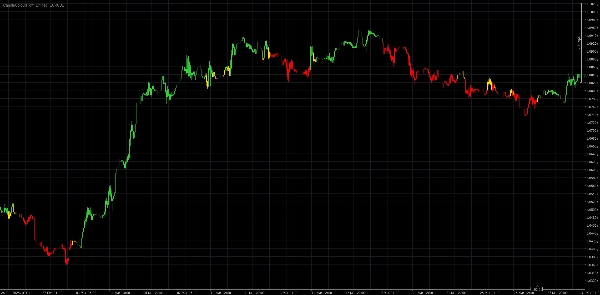
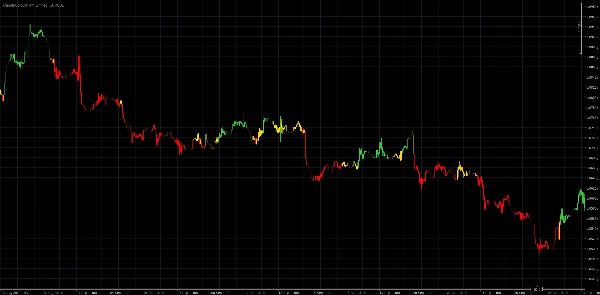
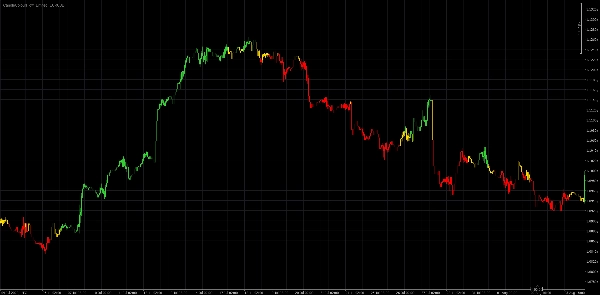
🔹 แท่งเทียนสีเขียว – บ่งชี้สภาพที่เอื้ออำนวยสำหรับการเปิดสถานะซื้อ
🔹 แท่งเทียนสีแดง – บ่งชี้โอกาสในการเทรดขาย
🔹 แท่งเทียนสีทอง – สัญญาณของความไม่แน่นอนในตลาด: อาจเป็นการรวมตัวหรือการต่อเนื่องของแนวโน้ม
💡 อะไรที่ทำให้ CandleColourFlow โดดเด่น?
- มุมมองภาพที่ชัดเจนเกี่ยวกับสภาพตลาดโดยไม่ต้องใช้ตัวบ่งชี้หลายตัว
- การตรวจจับการเปลี่ยนแปลงโมเมนตัมและโครงสร้างราคาโดยอัตโนมัติ
- เหมาะสำหรับการประเมินสถานะตลาดโดยรวมอย่างรวดเร็ว
⚠️ ข้อจำกัดความรับผิดชอบทางกฎหมาย:
ตัวบ่งชี้นี้มีไว้เพื่อการศึกษาเท่านั้น ไม่ถือเป็นคำแนะนำการลงทุนหรือคำแนะนำให้ดำเนินการทำธุรกรรมทางการเงินใดๆ
กำลังมองหาเพิ่มเติม?
เวอร์ชันเพิ่มเติมของ CandleColourFlow กำลังจะมาเร็วๆ นี้ – แต่ละเวอร์ชันมีคุณสมบัติพิเศษและรองรับตลาดที่กว้างขึ้น