
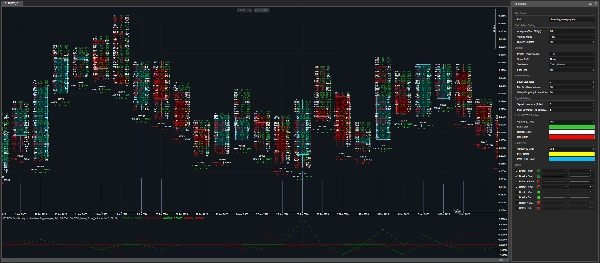

คำอธิบาย
Volume Profile TPO Bubble — โดย The Quant
Volume Profile TPO Bubble เป็นตัวบ่งชี้ cTrader พรีเมียมที่สร้างโดย The Quant.
ต้องการเข้าร่วมกับเราไหม? ลิงก์อยู่ในประวัติ
━━━━━━━━━━━━━━━━━━━━━━
VOLUME PROFILE TPO BUBBLE
━━━━━━━━━━━━━━━━━━━━━━
Volume Profile TPO Bubble เป็นตัวบ่งชี้อ่านตลาดครบถ้วนสำหรับ cTrader.
มันรวบรวมเครื่องมืออ่านตลาดที่ทรงพลังไว้ในตัวบ่งชี้ที่สะอาดหนึ่งเดียว:
◆ Volume Profile
◆ Bubble Chart
◆ TPO
◆ สัญญาณ POC Break & Retest สำหรับหุ่นยนต์
เครื่องมือนี้ออกแบบมาสำหรับเทรดเดอร์ที่ต้องการอ่าน โซนปริมาณ อย่างชัดเจนขึ้น, ระบุ ระดับ POC สำคัญ และใช้ระดับเหล่านั้นใน กลยุทธ์ด้วยตนเองหรืออัตโนมัติ.
มันถูกสร้างขึ้นสำหรับ cTrader โดยคำนึงถึงทั้ง การวิเคราะห์ด้วยสายตา และ การทำงานอัตโนมัติด้วย cBot.
━━━━━━━━━━━━━━━━━━━━━━
สิ่งที่ตัวบ่งชี้นี้ทำ
━━━━━━━━━━━━━━━━━━━━━━
โซนกิจกรรมตลาด
Volume Profile TPO Bubble ช่วยให้คุณระบุโซนที่ตลาดมีการเคลื่อนไหว.
โซนเหล่านี้เรียกว่า POCs หรือ จุดควบคุม.
POC คือพื้นที่ราคาที่มีกิจกรรมเข้มข้น.
เมื่อราคากลับมาที่พื้นที่นี้ อาจ ทำลายมัน, ทดสอบซ้ำ, ปฏิเสธมัน หรือ ตอบสนองจากมัน.
วัตถุประสงค์หลัก
เป้าหมายคือ ไม่ใช่ การทำนายตลาด.
เป้าหมายคือทำให้โซนตลาดสำคัญ มองเห็นง่ายขึ้น, เข้าใจง่ายขึ้น และ ใช้งานง่ายขึ้นในกลยุทธ์.
━━━━━━━━━━━━━━━━━━━━━━
โหมดการแสดงผลหลัก
━━━━━━━━━━━━━━━━━━━━━━
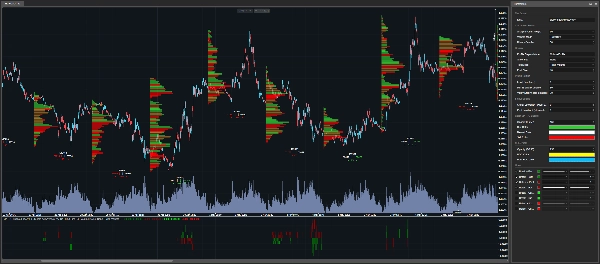
◆ Volume Profile
โหมด Volume Profile แสดงแถบปริมาณแนวนอนโดยตรงบน กราฟ cTrader.
แถบที่ใหญ่กว่าจะบ่งบอกว่าโซนราคานั้นสำคัญในช่วง แท่งเทียนวิเคราะห์ ที่เลือก.
โหมดนี้มีประโยชน์เมื่อคุณต้องการเห็นโครงสร้างเต็มของ การกระจายปริมาณ.
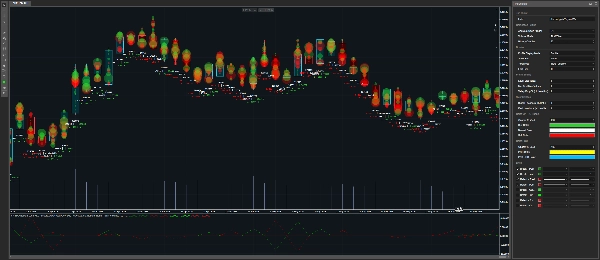
◆ Bubble Chart
โหมด Bubble Chart แสดงโซนปริมาณสำคัญเป็นฟอง.
ฟองที่ใหญ่กว่าจะบ่งบอกว่าโซนที่ตรวจพบสำคัญมากขึ้น.
โหมดนี้สร้างขึ้นสำหรับ การอ่านด้วยสายตาอย่างรวดเร็ว.
ช่วยให้คุณมองเห็นพื้นที่สำคัญที่สุดบนกราฟได้อย่างรวดเร็ว.
ถ้าคุณต้องการใช้ตัวบ่งชี้เป็น Bubble Chart เป็นหลัก คุณสามารถตั้งค่า Show POC เป็น None แล้วปรับ:
• Min % of Max Volume
• Valley Drop %
การตั้งค่าเหล่านี้ควบคุมจำนวนฟองที่คุณต้องการเห็น.
ค่าต่ำจะแสดง ฟองมากขึ้น.
ค่าที่สูงขึ้นจะแสดงเฉพาะ โซนที่สะอาดที่สุด.
◆ TPO
โหมด TPO ให้มุมมองที่ละเอียดขึ้นเกี่ยวกับสิ่งที่เกิดขึ้นภายในแท่งเทียน.
มันแสดง:
• ปริมาณซื้อ
• ปริมาณขาย
• เดลต้า
• กิจกรรมระดับราคา
โหมดนี้มีประโยชน์เมื่อคุณต้องการเข้าใจ โครงสร้างภายในของโซน ไม่ใช่แค่เห็นว่าปริมาณอยู่ที่ไหน.
━━━━━━━━━━━━━━━━━━━━━━
ตรรกะ TICK และ TICKXSIZE
━━━━━━━━━━━━━━━━━━━━━━
บริบทปริมาณ CFD
บน CFDs เทรดเดอร์จะไม่ได้รับปริมาณจากตลาดกลางเหมือนตลาดฟิวเจอร์ส.
แต่ปริมาณจะขึ้นอยู่กับ ข้อมูล tick ของโบรกเกอร์.
ตัวบ่งชี้นี้ให้โหมดการคำนวณปริมาณสองแบบ:
• Tick
• TickXSize
◆ Tick
แต่ละ tick นับเป็น หนึ่งหน่วย.
นี่คือการอ่านข้อมูล tick ของโบรกเกอร์อย่างง่าย.
◆ TickXSize
Ticks จะถูกถ่วงน้ำหนักตามขนาดการเคลื่อนไหวของราคา.
Tick ที่เคลื่อนราคามากกว่า 1 pip จะมีน้ำหนักมากกว่า tick ที่เคลื่อนราคาเพียง 0.1 pip.
สิ่งนี้ช่วยเปิดเผยโซนที่การเคลื่อนไหวมีผลกระทบมากขึ้น แม้ว่าการนับ tick ดิบเพียงอย่างเดียวจะไม่ทำให้โซนนั้นชัดเจน.
ความแตกต่างอย่างง่าย
Tick นับเหตุการณ์.
TickXSize นับเหตุการณ์พร้อมน้ำหนักของการเคลื่อนไหว.
━━━━━━━━━━━━━━━━━━━━━━
การตรวจจับ POC
━━━━━━━━━━━━━━━━━━━━━━
วิธีการตรวจจับ POCs
ตัวบ่งชี้ตรวจจับ โซน POC โดยใช้ยอดปริมาณและตรรกะการกรอง.
โซนต้อง แข็งแกร่งพอ และ แยกออกจากกันพอ เพื่อถือว่าเกี่ยวข้อง.
สิ่งนี้ช่วยหลีกเลี่ยงการแสดงพื้นที่เล็ก ๆ ที่มีเสียงรบกวนบนกราฟ.
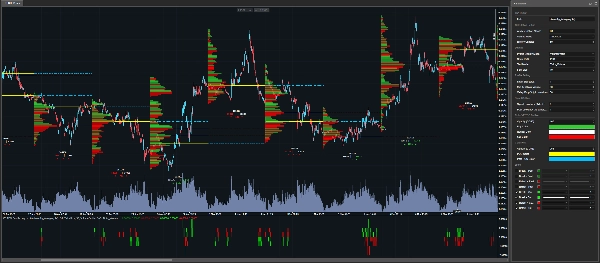
POCs ปัจจุบันและอดีต
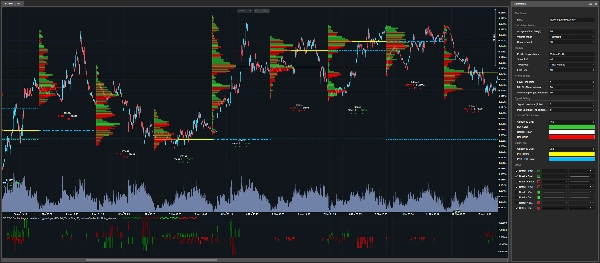
POCs ปัจจุบัน สามารถแสดงโดยตรงบนกราฟ.
พวกมันยังสามารถขยายไปยังแท่งเทียนวิเคราะห์ถัดไปด้วย เส้นประ.
POCs อดีต ก็สามารถแสดงได้เช่นกัน ช่วยให้เทรดเดอร์ติดตามระดับเก่าที่อาจยังสำคัญ.
━━━━━━━━━━━━━━━━━━━━━━
สัญญาณ Break & Retest พร้อมสำหรับหุ่นยนต์
━━━━━━━━━━━━━━━━━━━━━━
ตัวบ่งชี้ภาพและเครื่องมืออัตโนมัติ
Volume Profile TPO Bubble ไม่ใช่แค่ตัวบ่งชี้ภาพเท่านั้น.
มันยังเปิดเผย ชุดผลลัพธ์ ที่สามารถใช้ภายใน cBot หรือหุ่นยนต์เทรด.
ประเภทสัญญาณที่ตรวจจับได้
ตัวบ่งชี้สามารถตรวจจับ:
• การทำลายระดับ POC ปัจจุบัน
• การทดสอบซ้ำระดับ POC ปัจจุบัน
• การทำลายระดับ POC อดีต
• การทดสอบซ้ำระดับ POC อดีต
สิ่งนี้ช่วยให้หุ่นยนต์ตรวจจับเมื่อราคามีปฏิสัมพันธ์กับ โซนปริมาณสำคัญ.
━━━━━━━━━━━━━━━━━━━━━━
คะแนนสัญญาณ
━━━━━━━━━━━━━━━━━━━━━━
ความหมายของคะแนน
ตัวบ่งชี้ไม่เพียงแต่ส่งคืนสัญญาณเท่านั้น.
มันยังส่งคืน คะแนน ด้วย.
คะแนนบอกหุ่นยนต์ว่า โซน POC ใดถูกสัมผัส, ถูกทำลาย หรือถูกทดสอบซ้ำ.
ตรรกะคะแนน
การจัดอันดับขึ้นอยู่กับ ราคาปิดเปิด ของแท่งเทียนวิเคราะห์ที่เลือก.
คะแนนบวก แทนโซน POC ที่อยู่เหนือราคาเปิด.
คะแนนลบ แทนโซน POC ที่อยู่ต่ำกว่าราคาเปิด.
ตัวอย่าง
• +1 = โซน POC แรกเหนือราคาเปิด
• -1 = โซน POC แรกต่ำกว่าราคาเปิด
• +2 = โซน POC ที่สองเหนือราคาเปิด
• -3 = โซน POC ที่สามต่ำกว่าราคาเปิด
ตัวเลขที่ไกลจากศูนย์มากขึ้น หมายถึงโซนที่ไกลจากราคาเปิดมากขึ้น.
ทำไมจึงสำคัญสำหรับการทำงานอัตโนมัติ
สิ่งนี้มีประโยชน์สำหรับการทำงานอัตโนมัติเพราะหุ่นยนต์ไม่เพียงแต่รู้ว่าสัญญาณเกิดขึ้นเท่านั้น.
มันยังรู้ด้วยว่า สัญญาณเกิดขึ้นที่ไหน.
━━━━━━━━━━━━━━━━━━━━━━
พารามิเตอร์
━━━━━━━━━━━━━━━━━━━━━━
พารามิเตอร์ทั้งหมดจัดระเบียบตามหมวดหมู่เพื่อให้คุณเข้าใจได้อย่างรวดเร็วว่าการตั้งค่าแต่ละอย่างควบคุมอะไร.
━━━━━━━━━━━━━━━━━━━━━━
การตั้งค่าการคำนวณ
━━━━━━━━━━━━━━━━━━━━━━
◆ กรอบเวลาวิเคราะห์
• เลือกกรอบเวลาที่ใช้สร้างโปรไฟล์.
• กรอบเวลานี้เป็นฐานที่ใช้สร้างโปรไฟล์, ตรวจจับ POCs, และจัดอันดับคะแนนสัญญาณ.
ตัวอย่าง:
• รายวัน = โปรไฟล์หนึ่งรายการต่อวัน
• H4 = โปรไฟล์หนึ่งรายการทุกสี่ชั่วโมง
◆ โหมดปริมาณ
• เลือกวิธีการคำนวณปริมาณ tick.
โหมดที่มี:
• Tick = tick หนึ่งเท่ากับหนึ่งหน่วย
• TickXSize = ticks ถูกถ่วงน้ำหนักตามขนาดการเคลื่อนไหวของราคา
Tick เป็นโหมดง่าย.
TickXSize ให้ความสำคัญกับ ticks ที่เคลื่อนราคามากขึ้น.
◆ แท่งเทียนประวัติ
• กำหนดจำนวนแท่งเทียนเก่าจาก กรอบเวลาวิเคราะห์ ที่เก็บไว้บนกราฟ.
• แท่งเทียนมากขึ้นให้ บริบททางประวัติศาสตร์ มากขึ้น.
• แท่งเทียนน้อยลงทำให้กราฟ เบาขึ้น.
• ตัวบ่งชี้อาจเก็บขอบเขตเพิ่มเติมเล็กน้อยภายในเพื่อให้ POCs, Breaks และ Retests คำนวณอย่างถูกต้อง.
━━━━━━━━━━━━━━━━━━━━━━
การตั้งค่าการแสดงผล
━━━━━━━━━━━━━━━━━━━━━━
◆ โหมดการแสดงโปรไฟล์
• เลือกสิ่งที่จะแสดงบนกราฟ:
• ไม่มี
• Volume Profile
• Bubble
• TPO
ไม่มี มีประโยชน์สำหรับการทำงานอัตโนมัติเพราะมันลบภาพวาดออกจากกราฟในขณะที่ยังคงให้ผลลัพธ์ของตัวบ่งชี้ใช้งานได้.
สิ่งนี้ช่วยให้เทรดเดอร์รักษา กราฟที่สะอาด และยังใช้สัญญาณภายในหุ่นยนต์ได้.
◆ แสดง POC
• ควบคุมระดับ POC ที่จะแสดง.
ตัวเลือกที่มี:
• ไม่มี = ไม่มีเส้น POC
• PoC = ระดับ POC ปัจจุบัน
• PoC Past = ระดับ POC อดีต
• ทั้งหมด = ระดับ POC ปัจจุบันและอดีต
POCs ปัจจุบันสามารถขยายไปยังแท่งเทียนวิเคราะห์ถัดไปด้วย เส้นประ.
◆ โหมดข้อความ
• ควบคุมข้อมูลปริมาณที่แสดงใต้แท่งเทียน.
ตัวเลือกที่มี:
• ไม่มี = ไม่มีข้อความ
• ปริมาณ Tick = ข้อมูลปริมาณ tick
• เปอร์เซ็นต์เดลต้า = ความไม่สมดุลแสดงเป็นเปอร์เซ็นต์
สำหรับการทำงานอัตโนมัติ สามารถตั้งค่าเป็น ไม่มี เพื่อรักษาความสะอาดของกราฟ.
◆ ขนาดตัวอักษร
• ควบคุมขนาดของข้อความที่แสดง.
• เพิ่มขนาดเพื่อให้อ่านง่ายขึ้น.
• ลดขนาดถ้ากราฟดูแออัดเกินไป.
━━━━━━━━━━━━━━━━━━━━━━
การตั้งค่าโปรไฟล์
━━━━━━━━━━━━━━━━━━━━━━
◆ ขนาดระดับ
• ควบคุมขนาดของแต่ละระดับราคา.
• ค่าที่เล็กกว่าจะให้ รายละเอียดมากขึ้น.
• ค่าที่ใหญ่กว่าจะสร้าง โปรไฟล์ที่สะอาดและเบากว่า.
• ตัวบ่งชี้มีระบบความปลอดภัยเพื่อหลีกเลี่ยงการสร้างวัตถุกราฟมากเกินไป.
ถ้ามีข้อความแนะนำให้เพิ่ม ขนาดระดับ หมายความว่าตัวบ่งชี้กำลังปกป้องกราฟจากการโหลดเกินความจำเป็น.
ในกรณีนั้น จะมีการใช้ระดับขั้นต่ำที่ปลอดภัยภายในแล้ว.
◆ Min % ของ Max Volume
• กรองโซนตามความแข็งแกร่ง.
• ตัวบ่งชี้จะค้นหาโซนปริมาณที่แข็งแกร่งที่สุดภายในแท่งเทียน.
• จากนั้นจะเก็บเฉพาะโซนที่มีอย่างน้อยเปอร์เซ็นต์ที่เลือกของโซนสูงสุดนั้น.
ตัวอย่าง:
• ถ้า Min % ของ Max Volume ตั้งไว้ที่ 80% จะเลือกเฉพาะโซนที่มีอย่างน้อย 80% ของโซนปริมาณสูงสุดเท่านั้น.
ค่าต่ำจะแสดง โซนมากขึ้น.
ค่าที่สูงขึ้นจะแสดง โซนน้อยลงแต่แข็งแกร่งกว่า.
Min % ของ Max Volume คือฟิลเตอร์พลังงาน.
◆ Valley Drop %
• ตรวจสอบว่า POC แยกออกจากกันอย่างชัดเจนหรือไม่.
• คิดว่า POC เป็น ยอดเขา.
• เพื่อยืนยันว่าเป็นยอดจริง ตัวบ่งชี้จะตรวจสอบว่าปริมาณลดลงเพียงพอรอบ ๆ มันหรือไม่.
ค่าต่ำยอมรับ โซนมากขึ้น.
ค่าที่สูงขึ้นจะเก็บเฉพาะ โซนที่สะอาดและแยกจากกันมากขึ้น.
Valley Drop คือฟิลเตอร์การแยกตัว.
━━━━━━━━━━━━━━━━━━━━━━
การตั้งค่าสัญญาณ
━━━━━━━━━━━━━━━━━━━━━━
◆ การมองย้อนสัญญาณ
• เลือกแท่งเทียนที่ปิดแล้วซึ่งให้ POCs ที่ใช้สำหรับสัญญาณ Break และ Retest ปัจจุบัน.
ค่าที่มี:
• 0 = แท่งเทียนที่ปิดล่าสุด
• 1 = แท่งเทียนก่อนแท่งเทียนที่ปิดล่าสุด
• 2 = ย้อนกลับไปมากขึ้น
สิ่งนี้ช่วยให้เทรดเดอร์ทดสอบสัญญาณโดยอิงจากการอ้างอิง POC ที่ใหม่กว่าหรือเก่ากว่า.
◆ การมองย้อนอดีต
• กำหนดจำนวนแท่งเทียนเก่าที่สแกนเพื่อสร้าง ระดับ POC อดีต.
• ค่าที่สูงกว่าจะช่วยให้ตัวบ่งชี้ค้นหาโซน POC เก่าที่อาจยังสำคัญ.
━━━━━━━━━━━━━━━━━━━━━━
การตั้งค่าสี
━━━━━━━━━━━━━━━━━━━━━━
◆ สีโปรไฟล์
การตั้งค่าเหล่านี้ปรับแต่งสีของโปรไฟล์ภาพ:
• สีซื้อ
• สีขาย
• สีเป็นกลาง
• ความทึบของโปรไฟล์
การตั้งค่าเหล่านี้ควบคุมลักษณะของ Volume Profile, Bubble Chart และ TPO.
◆ สี POC
การตั้งค่าเหล่านี้ปรับแต่งสีของระดับ POC ปัจจุบันและอดีต:
• สี POC
• สี POC อดีต
• ความทึบ POC
การใช้สีที่แตกต่างกันสำหรับ POCs ปัจจุบัน และ POCs อดีต ทำให้กราฟอ่านง่ายขึ้น.
━━━━━━━━━━━━━━━━━━━━━━
ตัวบ่งชี้นี้สำหรับใคร?
━━━━━━━━━━━━━━━━━━━━━━
ตัวบ่งชี้นี้ออกแบบมาสำหรับ:
◆ ผู้ใช้ cTrader
◆ เทรดเดอร์ Volume Profile
◆ เทรดเดอร์ TPO
◆ ผู้ใช้ Bubble Chart
◆ เทรดเดอร์ POC
◆ เทรดเดอร์อัลกอริทึม
◆ นักพัฒนา cBot
◆ เทรดเดอร์ที่ต้องการ เครื่องมือภาพและผลลัพธ์พร้อมสำหรับหุ่นยนต์
◆ เทรดเดอร์ที่ต้องการทดสอบ ตรรกะ Break และ Retest รอบโซนปริมาณ
━━━━━━━━━━━━━━━━━━━━━━
หมายเหตุสำคัญ
━━━━━━━━━━━━━━━━━━━━━━
ตัวบ่งชี้นี้ ไม่ใช่ปุ่มวิเศษ.
มัน ไม่ ทำนายตลาด.
มันช่วยเทรดเดอร์ระบุ โซนตลาดสำคัญ สังเกตราคาตอบสนอง และสร้างกลยุทธ์ที่สามารถ ทดสอบ, ปรับแต่ง และ ทำงานอัตโนมัติ.
ทดสอบกลยุทธ์ของคุณเสมอก่อนใช้งานจริง.
━━━━━━━━━━━━━━━━━━━━━━
THE QUANT
━━━━━━━━━━━━━━━━━━━━━━
The Quant เป็นโครงการเทรดและเทรดอัลกอริทึมที่เน้นไปที่:
◆ ข้อมูล
◆ การทำงานอัตโนมัติ
◆ การทดสอบย้อนหลัง
◆ การปรับแต่ง
◆ การป้องกันการฟิตเกิน
เป้าหมายคือช่วยเทรดเดอร์เปลี่ยนจากไอเดียไปสู่ กลยุทธ์ที่ทดสอบได้, มีโครงสร้าง และ ทำงานอัตโนมัติได้.
The Quant สำหรับผู้เชื่อในข้อมูล.
สรุป
Designed for both manual traders and algorithmic developers, it supports cBot automation by providing break and retest signals of current and past POC levels, along with scoring to indicate the relative position of these zones to the candle open price. This facilitates the creation and testing of volume-based trading strategies.
Volume calculation can be set to simple tick counts or weighted by price movement size (TickXSize), enhancing the detection of impactful volume zones, especially in CFD markets where volume data is broker-dependent. The indicator offers customizable display modes, filtering parameters for volume zone strength and isolation, and color settings for clarity.
Intended for cTrader users interested in volume profile, TPO, bubble chart visualization, and automated trading strategies, it aids in identifying significant volume zones and price reactions without predicting market direction.
รีวิวจากลูกค้า
5 | 100 % | |
4 | 0 % | |
3 | 0 % | |
2 | 0 % | |
1 | 0 % |